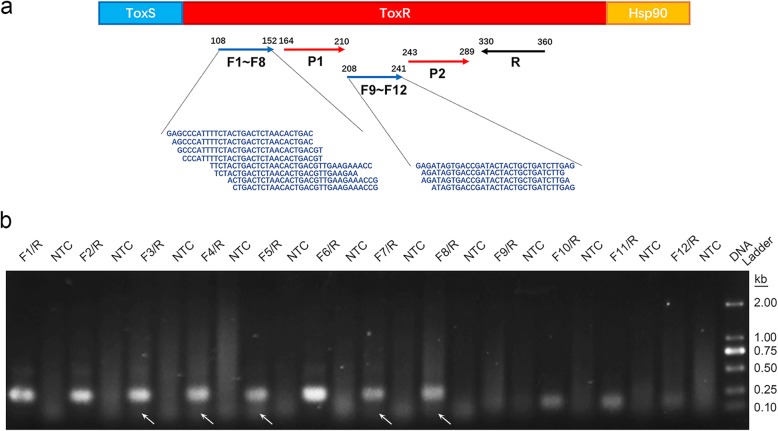
Fig. 2.
Relative positions of the primer/probe sequences and the initial screening of the primer pairs. (a) The upper horizontal line represents the toxR gene and its relative position on the genome. The blue arrows indicate the forward primer positions and the amplification direction. The red arrows indicate the probe positions and the amplification direction. The black arrow indicates the reverse primer position and the amplification direction. The forward primer sequences are written under their respective positions. (b) Agarose gel image showing the amplification results for the 12 primer pairs. The primer pair name is indicated at the top of each lane. The NTC lane immediately after is the no-template control of the respective primer pair. The band sizes of the DNA ladder are shown on the right. The white arrows indicate primer dimer bands

