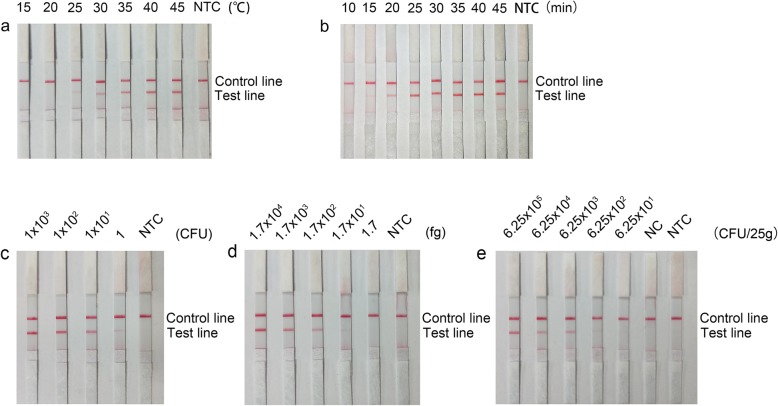
Fig. 6.
Optimization and detection limit of the RPA-LFD method. (a) Image showing the LFD results of RPA amplification under different temperatures. The temperatures under which the RPA reactions were performed are indicated on top of each dipstick. The amplification template was V. alginolyticus. The NTC dipstick is the no-template control that was performed at 40 °C. (b) Image showing the LFD results of RPA amplification with different reaction times. The times for which the RPA reactions were performed are indicated on top of each dipstick. The amplification template was V. alginolyticus. The NTC dipstick is the no-template control that was performed for 45 min. (c) Image showing the LFD results of RPA amplification with different amounts of V. alginolyticus. The amounts tested are indicated on top of each dipstick. The NTC dipstick is the no-template control. The reactions were performed at 40 °C for 25 min. (d) Image showing the LFD results of RPA amplification with different amounts of purified genomic DNA of V. alginolyticus. The amounts of DNA tested are indicated on top of each dipstick. The NTC dipstick is the no-template control. The reactions were performed at 40 °C for 25 min. (e) Image showing the RPA-LFD test results for shrimp samples spiked with V. alginolyticus. The spiked amounts are indicated on top of each dipstick. The NC dipstick is the control of the shrimp sample without spiking. The NTC dipstick is the no-template control. The reactions were performed at 40 °C for 25 min. The positions of the control and test lines are indicated on the right of the images

