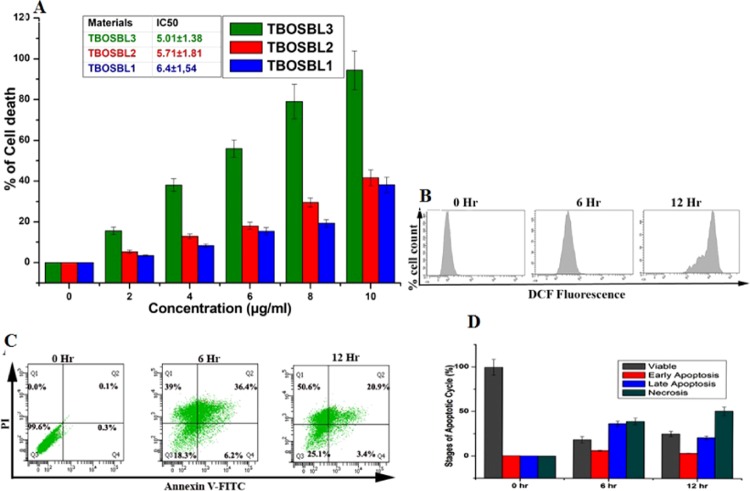
Figure 7.
(A) MTT assay data of TBOSBLs for 6 h. (B) Reactive oxygen species (ROS) level with time of TBOSBL3-treated HCT-116 cells. (C) Graphical presentation of annexin V, FITC/propidium iodide (PI) positive cells with time of treatment with 5 μg/mL TBOSBL3 by flow cytometry. (D) % of apoptotic HCT-116 cells in a time-dependent manner.

