
Figure 2.
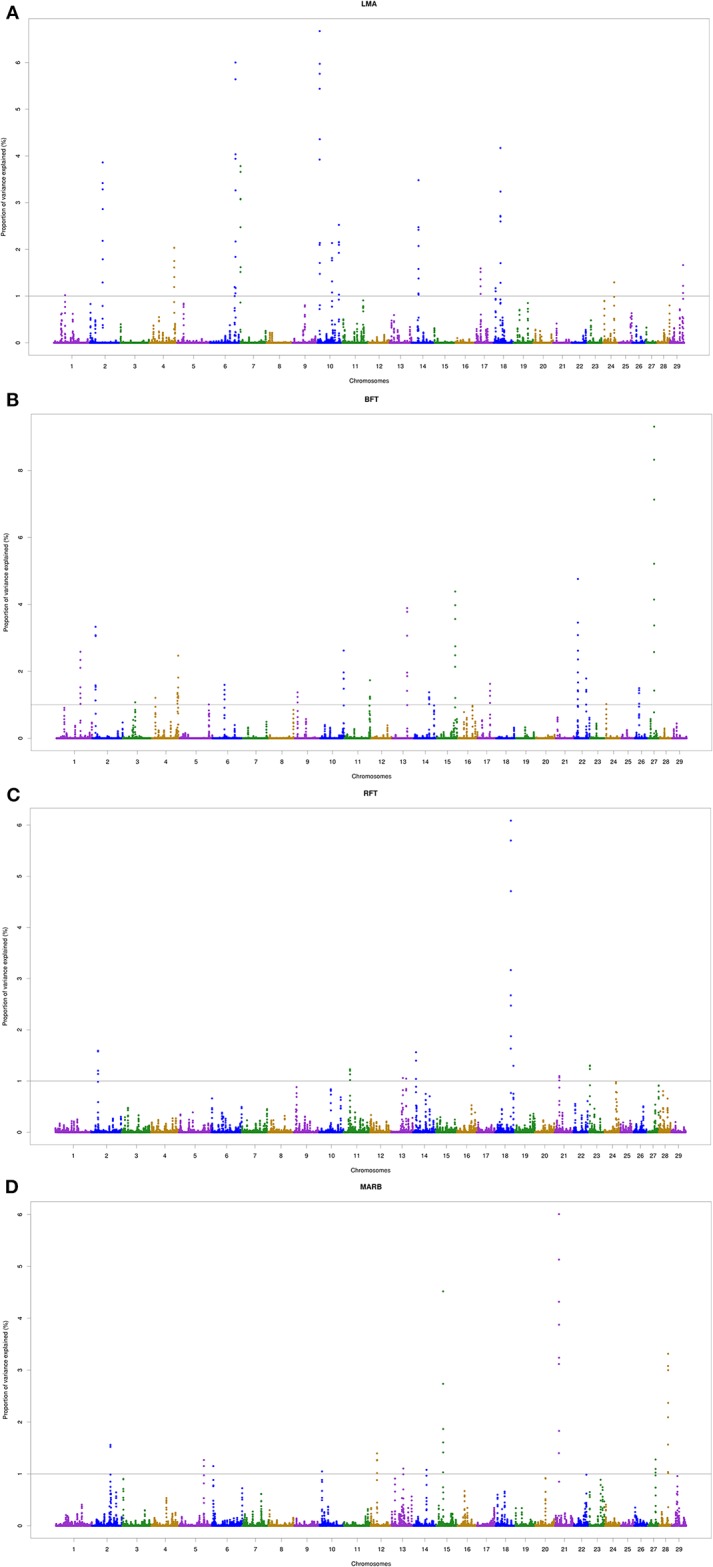
Manhattan plots of the genome-wide association analyses for Longissimus muscle area (A; LMA), backfat thickness (B; BFT), rump fat thickness (C; RFT) and marbling score (D; MARB) traits. The 29 autosomal chromosomes are shown in different colors. The x-axis represents the chromosome number whereas the y-axis shows the proportion of genetic variance explained by five adjacent SNPs. The gray line corresponds to the genome-wide threshold of each window that explained more than 1% of genetic variance.