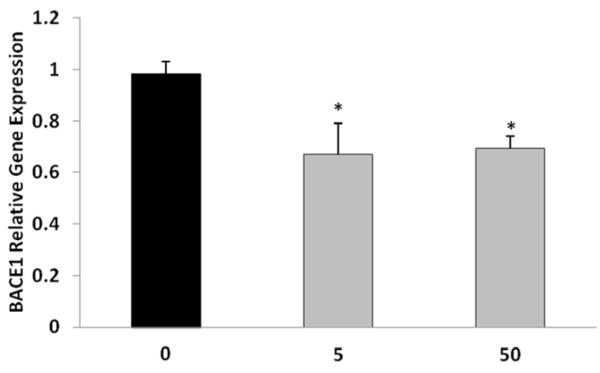
Figure 2. BACE1 relative gene expression within the cerebral cortices of R1.40 transgenic mice following tolfenamic acid exposure.
Hemizygous transgenic APP YAC mice were administered 0, 5 or 50 mg/kg/day tolfenamic acid for 34 days. BACE1 mRNA levels were measured in the cerebral cortex by real time PCR with β-actin as endogenous control as illustrated in the methods section. Values shown are the mean ± SEM, n=5 in each group, p=0.0116 as determined by one-way ANOVA with Tukey-Kramer post-test *p<0.05.

