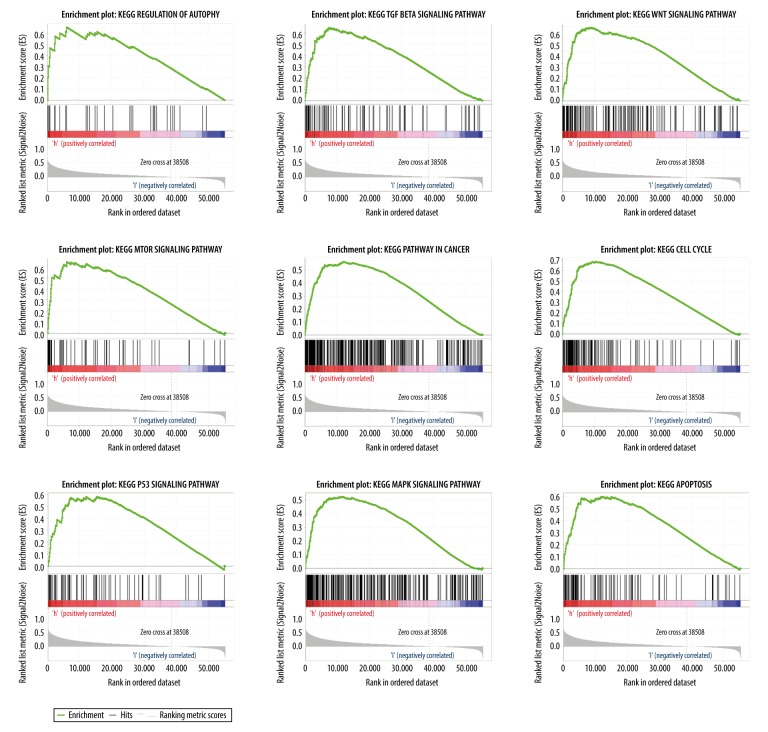
Figure 5.
Enrichment plots from the GSEA in TCGA HCC. Several pathways and biological processes were differentially enriched in high (AGGF1) expression HCC. ES – enrichment score; NES – normalized ES; NOM P-val – normalized P-value; GSEA – Gene Set Enrichment Analysis; TCGA – The Cancer Genome Atlas; HCC – hepatocellular carcinoma; AGGF1 – angiogenic factor with G patch and FHA domains 1.

