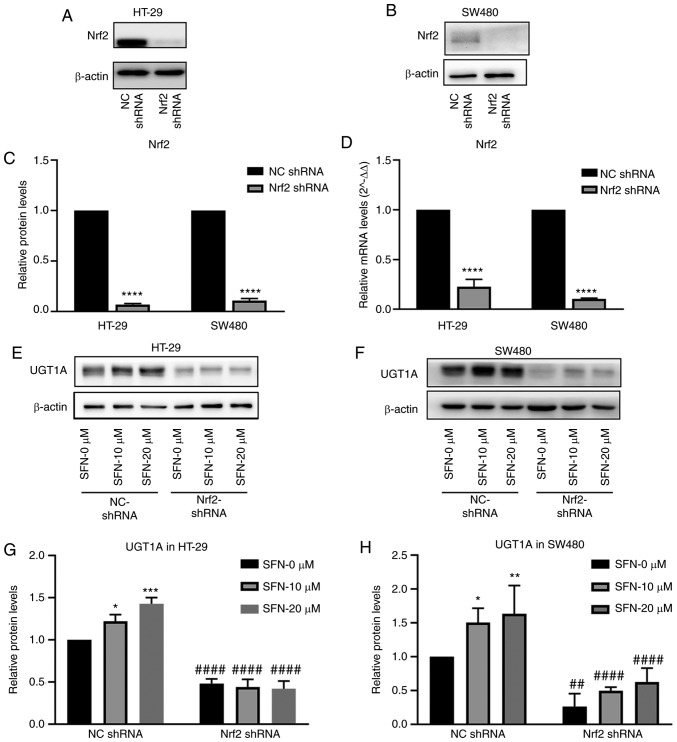
Figure 5.
Effect of Nrf2 on UGT1A expression induced by SFN. The Nrf2 gene was knocked down in SW480 and HT-29 cells. (A and B) The Nrf2 protein levels in HT-29 and SW480 cells were assessed by immunoblotting. (C) The expression levels of Nrf2 were quantified by ImageJ and illustrated by a bar legend. The statistical significance of the results was analyzed by Student's t-test. ****P<0.0001 vs. NC shRNA. (D) The transcriptional level of Nrf2 was quantified by RT-qPCR and illustrated by a bar legend. ****P<0.0001 vs. NC shRNA. The statistical significance of the results was analyzed by Student's t-test. (E and F) The expression levels of UGT1A in HT-29 and SW480 cells decreased in Nrf2-knockdown cells, and the induction effect of SFN on UGT1A expression decreased upon Nrf2-gene knockdown. (G and H) The UGT1A expression in various groups presented in the images of parts E and F was quantified by ImageJ. The statistical significance of the results was analyzed by two-way analysis of variance. *P<0.05, **P<0.01, ***P<0.001 vs. the SFN 0 µM group; ##P<0.01, #####P<0.0001 vs. the NC shRNA group. The results are expressed as the mean ± standard deviation of 3 independent experiments. SFN, sulforaphane; Nrf2, nuclear factor, erythroid 2 like 2; NC, negative control; shRNA, short hairpin RNA; RT-qPCR, reverse transcription-quantitative polymerase chain reaction.

