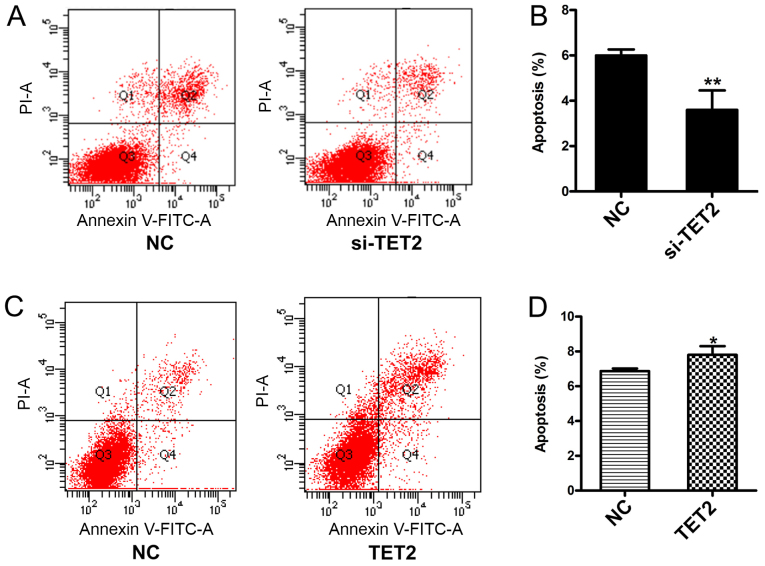
Figure 3.
Alterations to the proportion of apoptotic HaCaT cells in response to TET2 knockdown or overexpression. Proportion of apoptotic cells was (A) determined by flow cytometry and (B) quantified following TET2 knockdown in HaCaT cells. Proportion of apoptotic cells was (C) determined by flow cytometry and (D) quantified following TET2 overexpression in HaCaT cells. Data are presented as the mean ± SD of three independent experiments performed in triplicate. *P<0.05, **P<0.01 vs. NC group. TET2, ten-eleven translocation-2; NC, negative control; PI, propidium iodide; si, small interfering RNA.

