Figure 5.
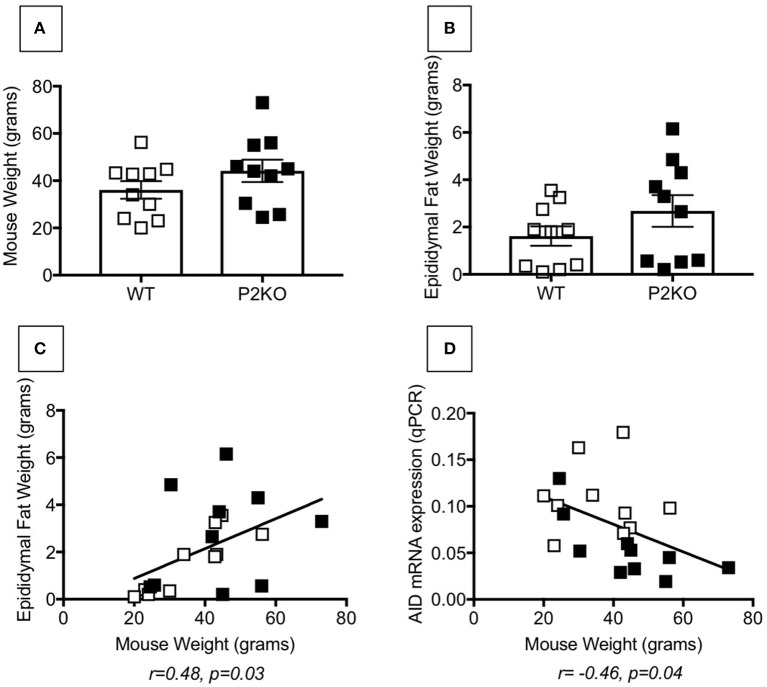
Comparable fat measures in P2KO vs. WT mice. Ten pairs of old WT and P2KO mice were sacrificed. Mouse weight and epididymal VAT weight are shown in (A,B), respectively. (C) Correlation between mouse weight and epididymal VAT weight. Pearson's r and p-values are at the bottom of the figure. (D) Correlation between mouse weight and mRNA expression of AID in stimulated splenic B cells after 5 day stimulation with LPS. Pearson's r and p-values are at the bottom of the figure.

