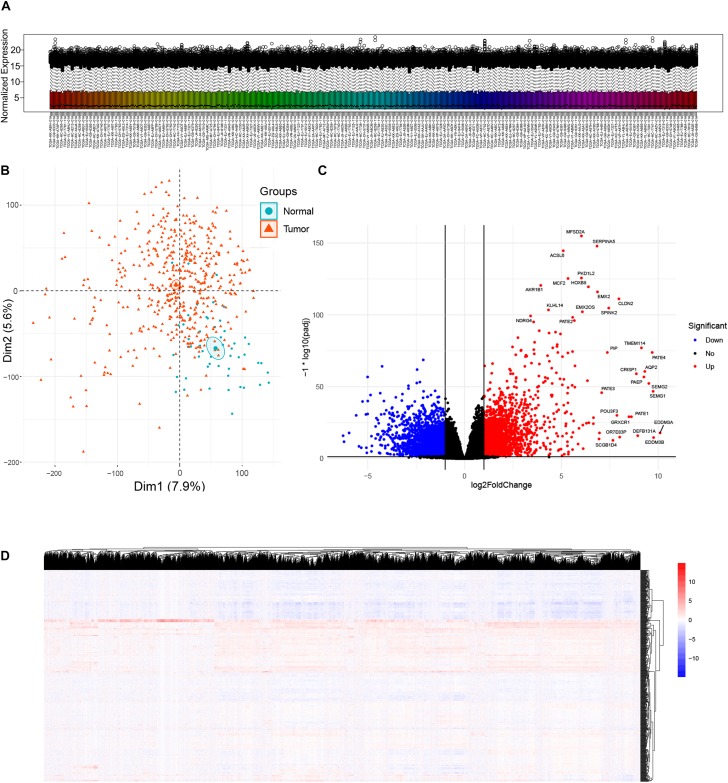
FIGURE 1.
Analysis of differentially expressed genes (DEGs) between prostate cancer and normal samples in TCGA Prostate Adenocarcinoma (PRAD) datasets. (A) Box plot showing expression distributions for normalized data for each sample. The boxes are randomly colored with rainbow colors. Normalization method: Variance Stabilizing Transformation/DESeq2 package. (B) Principal component analysis (PCA) plot of the mRNA expression data based on the top two principal components that characterizes the trends exhibited by the expression profiles of tumor and normal tissues, respectively. Each dot represents a sample and each color represents the type of the sample. (C) Volcano plot showing DEGs between tumor and normal tissues. X-axis represents log2 fold change and Y-axis represents –log10 (adjusted p-value). Red dots represent upregulated DEGs (n = 3157) and blue dots represent downregulated DEGs (n = 3367) in prostate cancer. DEGs screening cutoff: fold change =2 and adjusted p-value < 0.05. (D) Heat map displaying hierarchical clustering of DEGs (n = 6524). Red denotes increased gene expression levels and blue denotes decreased levels.

