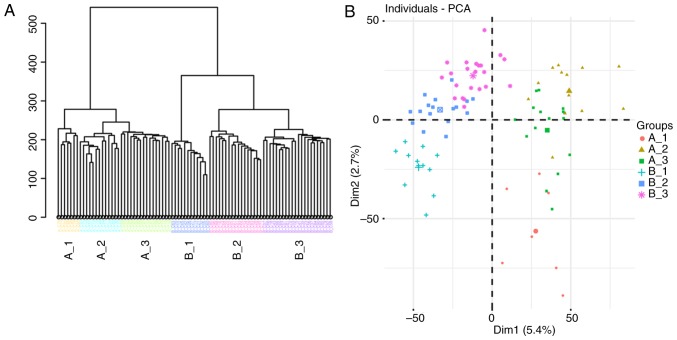
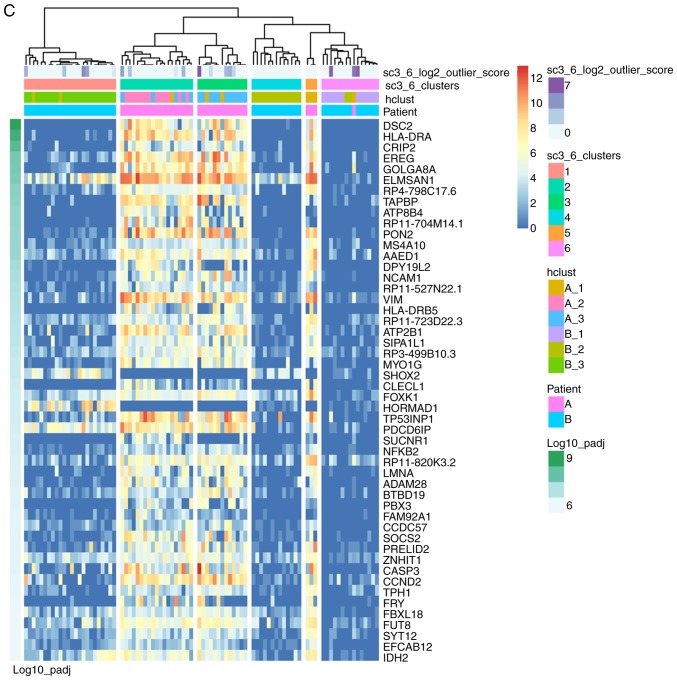
Figure 1.
Subpopulations of 87 acute myeloid leukemia single cells. (A) Hierarchical clustering separated single cells into six groups. (B) A total of six groups were separated with each other in PCA. (C) SC3 clustering of 87 single cells demonstrated the gene expression features of six groups. PCA, principal component analysis.


