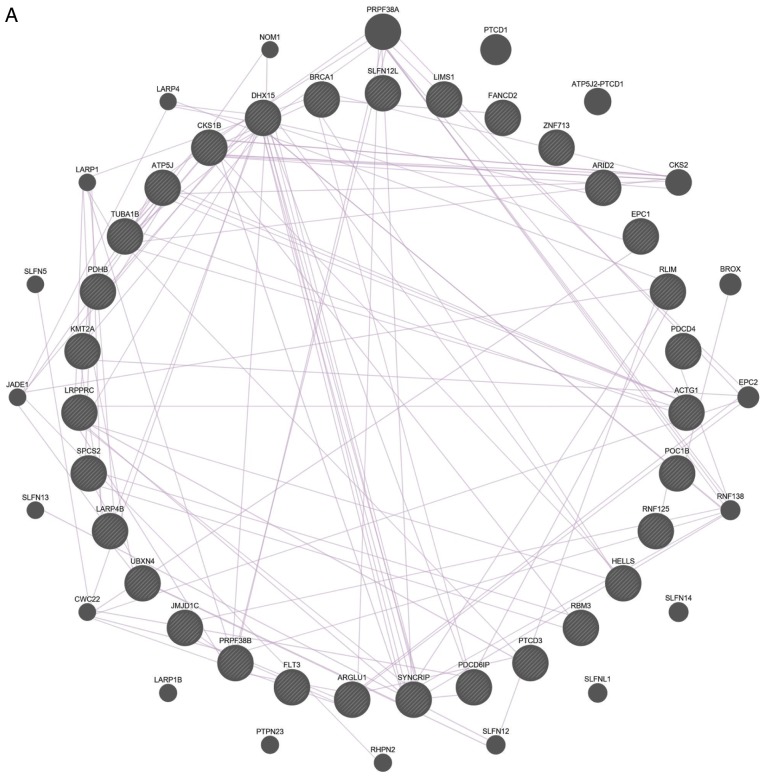
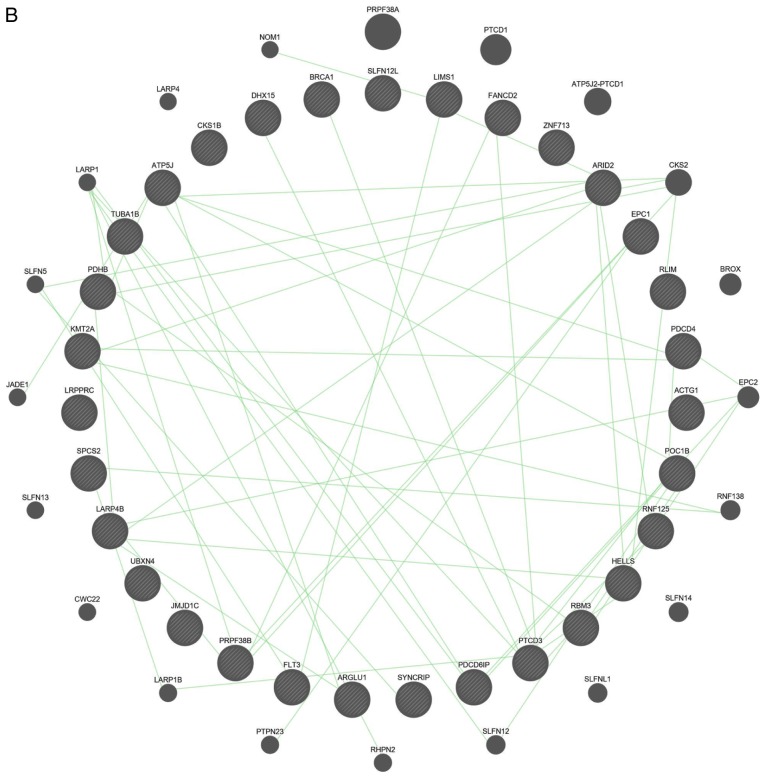
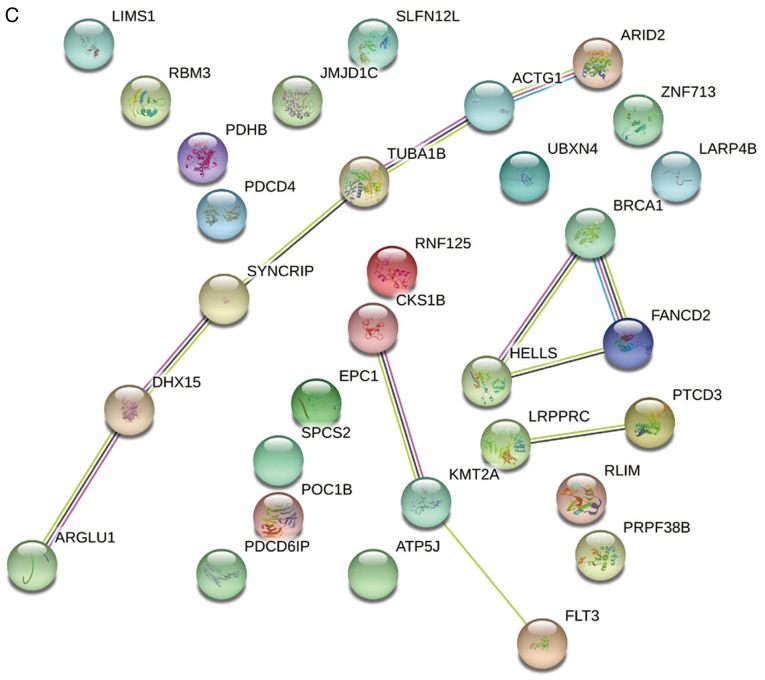
Figure 4.
Gene-gene and protein-protein interaction networks of 31 differentially expressed genes. (A) Co-expression network and (B) genetic network from Gene Multiple Association Network Integration Algorithm. Nodes indicate genes and lines indicate interactions. Gene-gene and protein-protein interaction networks of 31 differentially expressed genes. (C) Protein-protein interaction networks. Nodes indicate proteins and lines indicate interactions.


