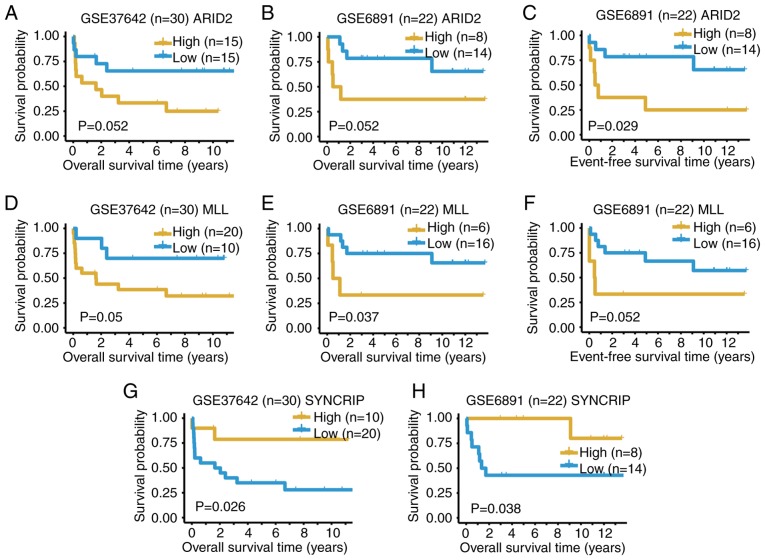
Figure 5.
Kaplan-Meier survival curves of t(8;21) patients with acute myeloid leukemia from datasets GSE37642 (n=30) and GSE6891 (n=22) using genes ARID2, MLL and SYNCRIP. Overall survival curves using ARID2 for (A) GSE37642 and (B) GSE6891. (C) Event-free survival curve using ARID2 from the dataset GSE6891. Overall survival curves using MLL for (D) GSE37642 and (E) GSE6891. (F) Event-free survival curve using ARID2 from the dataset GSE6891. Overall survival curves using SYNCRIP for (G) GSE37642 and (H) GSE6891. ARID2, AT-rich interaction domain 2; MLL, lysine methyltransferase 2A; SYNCRIP, synaptotagmin binding cytoplasmic RNA interacting protein.

