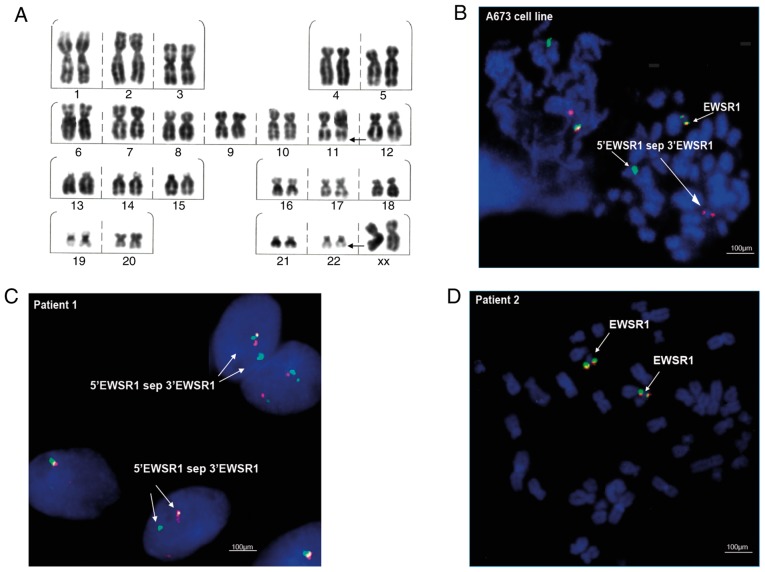
Figure 2.
Cytogenetic analysis. (A) Karyotype in patient 1: 46,XX,t(11;22)(q22;q12). FISH analysis with Cytocell Aquarius EWSR1 Breakapart Probes in (B) the A673 cell line, positive for EWSR1 translocation; (C) patient 1, positive for EWSR1 translocation, and (D) patient 2, with EWSR1 in metaphase without translocation: ish 22q12(EWSR1×2). Red probes, 3′EWSR1; green probes, 5′EWSR1. EWSR1, Ewing sarcoma region 1.

