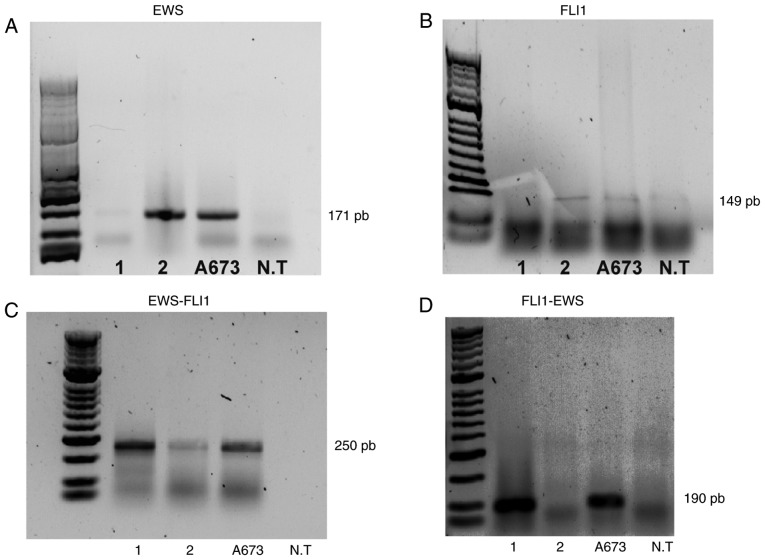
Figure 3.
PCR analysis. The conventional and nested PCR products from A673 cells, NT cells and patients 1 and 2 demonstrate the presence of the EWS-FLI1 fusion gene in the patient samples and in the Ewing sarcoma A673 cell line. GAPDH serves as a loading control. NT=non-tumor. (A) EWS; (B) FLI1; (C) EWS-FLI1; (D) FLI1-EWS.

