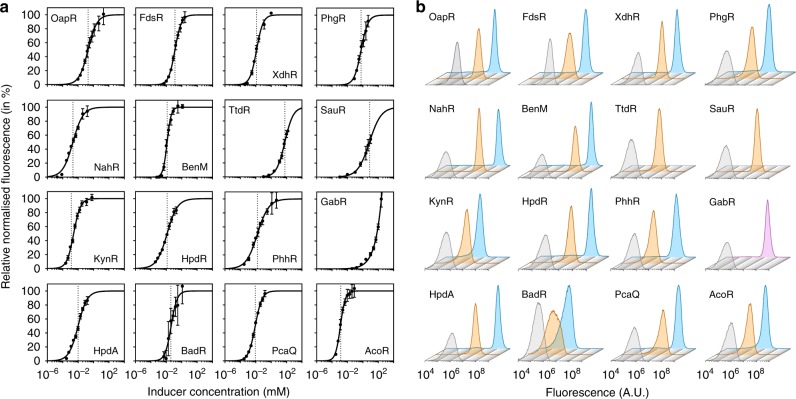
Fig. 5. Response function and induction homogeneity.
a Relative normalised fluorescence of C. necator carrying the various inducible system–reporter constructs in response to different concentrations of their corresponding primary inducers. Measurements were taken 80 min after the inducer had been extracellularly added. The dose–responses were fit using a Hill function (see Methods section). The maximum level of reporter output bmax was set to 100% (except in case of the GABA-inducible system where the absolute normalised fluorescence corresponding to the highest GABA concentration tested was set to 100%). The inducer concentration that mediates half-maximal reporter output Km is indicated by a dotted line. Data are mean ± SD, n = 3, non-linear regression. Source data are provided as a Source Data file. b Evaluation of induction homogeneity by flow cytometry. The fluorescence intensity of 100,000 individual cells was determined for each inducible system–reporter construct 2 h after extracellular addition of inducer. Uninduced cells (grey) are compared to cultures supplemented with their cognate effector at final concentrations corresponding to 50% (orange) and 95% (blue; 90% in case of the phenylglyoxylate-inducible system) of the maximum level of reporter output bmax. The tartrate- and sulfonatoacetate-inducible systems were only evaluated for induction homogeneity at 50% of bmax due to solubility limits and inducer toxicity, respectively. Since bmax could not be calculated for the GABA-inducible system, induction homogeneity was determined using a final concentration of 250 mM (purple).

