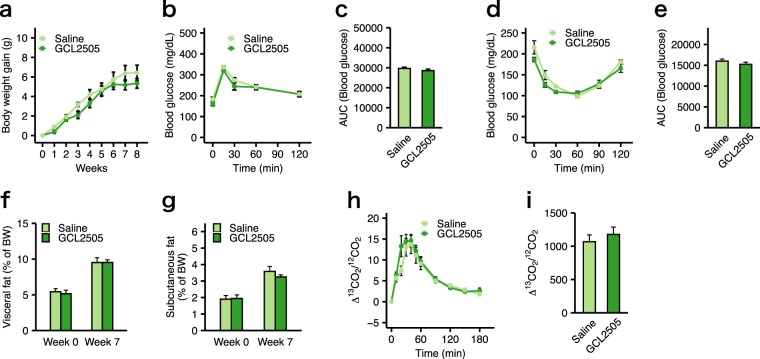
Figure 2.
Effects of GCL2505 treatment are not observed in high-fat diet-fed Gpr43−/− mice. (a) Body weight gain. (b,c) Blood glucose curve and the area under the curve (AUC) after an oral glucose challenge. (d,e) Blood glucose curve and the AUC after an intraperitoneal injection of insulin. (f,g) Computed tomography (CT)-estimated proportions of visceral and subcutaneous fat weight. (h,i) Breath 13CO2:12CO2 isotope ratio after an oral gavage of 13C-labelled palmitate. Specific details are provided in the Fig. 1 legend. Data are presented as the mean ± SEM, and were analysed with Welch’s t-test (*P < 0.05) (a,c,e,f,g,h,i) or two-way repeated-measurement ANOVA with the Bonferroni post-hoc test (*P < 0.05) (b,d).

