Figure 4.
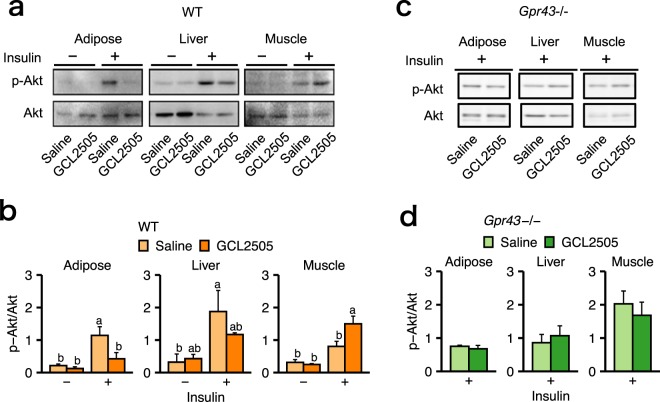
GPR43 suppresses insulin signalling in the adipose tissue, but not in the muscle or liver. Representative images of immunoreactive bands images (a,c) and its intensities representing (b,d) the insulin-stimulated Akt phosphorylation of Ser473 and total Akt in the adipose tissue, muscle and liver of WT mice (n = 4) and Gpr43−/− mice (n = 3) that had fasted for 6 h. Data are presented as the mean ± SEM, and were analysed with Tukey’s test. Different letters next to bars indicate a significant difference (P < 0.05).

