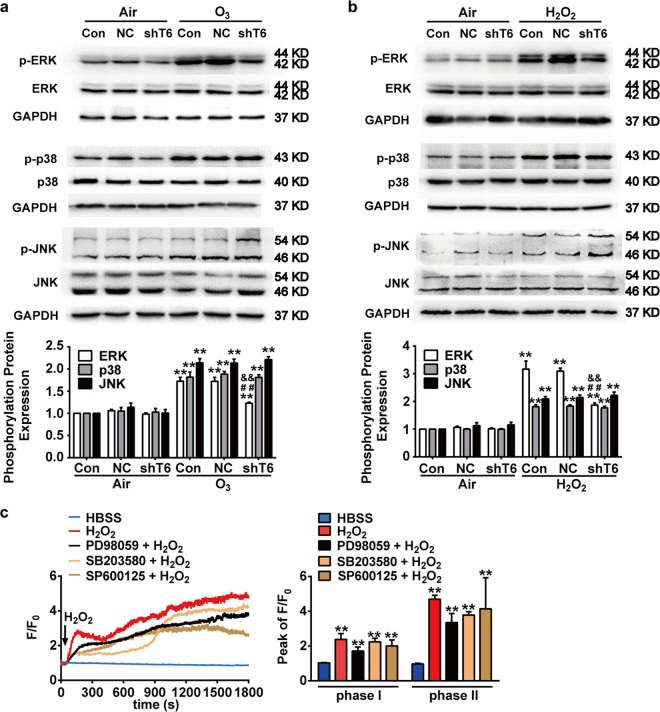
Fig. 8. Role of TRPC6 in oxidative stress-induced activation of MAPK signal pathway.
a, b After NC or shTRPC6 infection, 16HBE cells were exposed to O3 (100 ppb) for 30 min (a) or H2O2 (100 μM) for 15 min (b) respectively. Phosphorylation levels of ERK, p38, JNK were analyzed by western blot. Data represent the mean ± SEM, n = 5. **P < 0.01 compared with Control group, ##P < 0.01 compared with O3 or H2O2 group, &&P < 0.01 compared with NC + O3 or NC + H2O2 group. c 16HBE cells were loaded with the Ca2+ indicator Fluo-4/AM (5 μM) in Hanks’ solution for 30 min to measure [Ca2+]i. The [Ca2+]i in the cells was expressed as a pseudo-ratio value of the relative fluorescence intensity (F/F0) (Left). Bar graph shows the mean peak value of F/F0 traces (Peak of F/F0) of the experiments (Right). After pretreatment with or without PD98059 (25 μM), SB203580 (25 μM) or SP600125 (25 μM) for 1 h, 16HBE cells were stimulated with H2O2 (100 μM). **P < 0.01 compared with HBSS control group. Each trace represents the mean from three independent experiments that were derived from 20 to 40 cells in each single experiment. NC: Negative Control, shT6: shRNA TRPC6.

