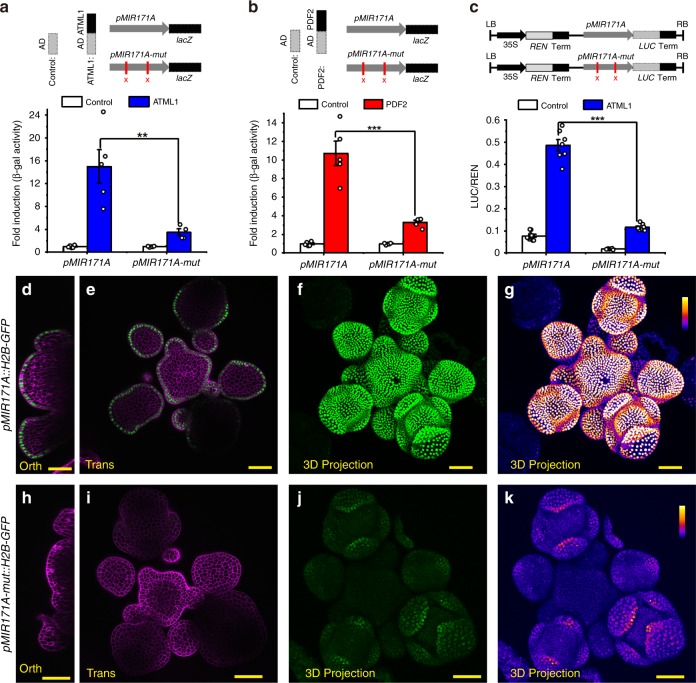
Fig. 5. Epidermis specific cis-regulatory elements are required for the activation of miR171.
a, b Mutations in the MIR171A promoter significantly reduced its interaction with ATML1 (a) or PDF2 (b) in Y1H. Upper panel: sketch of the reporter used in the study. AD with no fusion protein was included as the control. The lacZ reporter was under the control of either the MIR171A promoter (pMIR171A::lacZ) or the MIR171A promoter with two sites of TTAAATGC mutated (pMIR171A-mut::lacZ). Lower panel: mutations in pMIR171A significantly reduced the activation of the pMIR171A::lacZ by ATML1 (a) or PDF2 (b). Bar: mean ± SE (a: n = 5 biological replicates for AD control and AD-ATML1, except that n = 4 biological replicates for AD-ATML1 on pMIR171A-mut::lacZ; b: n = 5 biological replicates for AD control and AD-PDF2). **P < 0.01, ***P < 0.001 (Student’s two-tailed t-test). c Dual-luciferase assay shows that the activation of MIR171A promoter activities by ATML1 is greatly compromised by the two mutations in the MIR171A promoter. The LUC/REN in cells co-transformed with the pMIR171A::LUC reporter and the ATML1 effector (n = 7 biological replicates) is significantly higher than that in tobacco cells co-transformed with the pMIR171A-mut::LUC reporter and the same effector (n = 8 biological replicates). ***P < 0.001 (Student’s two-tailed t-test). d–g Expression of pMIR171A::H2B-GFP in an Arabidopsis SAM, from the orthogonal view (d), in the transverse optical section in corpus (e), and from the 3D projection view (f, g). h–k Expression of pMIR171A-mut::H2B-GFP in the SAM, from the orthogonal view (h), transverse optical section view in corpus (i), and from the 3D projection view (j, k). The confocal settings for imaging GFP in d–k are identical, and the quantification of GFP is indicated by the identical color bar in g, k. d, e, h, i: merge of GFP (green) and PI counterstain (purple); f, j: GFP (green); g, k: GFP quantified from f, j (quantification indicated by color). Scale bar: 20 µm; color bar in g, k: fire quantification of the signal intensity. Source data underlying Fig. 5a–c are provided as a Source Data file.

