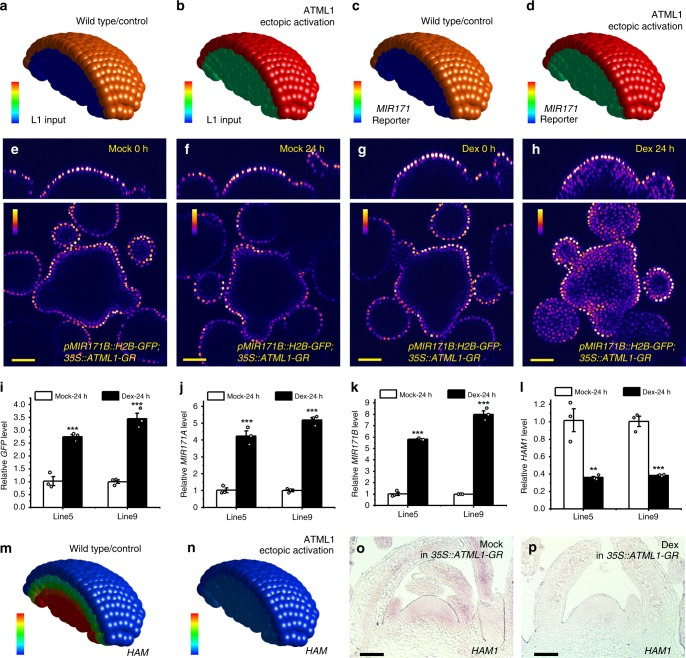
Fig. 7. The 3D computational model simulates the L1-miR171-HAM regulatory circuit in SAMs.
a, b Input of the ATML1 level (L1 input) for the computational simulation in (c, m) and (d, n). Color indicates the level of ATML1 input, with the gradient from red (maximum, 1.1 a.u.) to blue (none). c, d Simulated promoter activity of MIR171 in the SAMs from the wild type control (c) and the plant with ectopic activation of ATML1 (d). Color indicates the simulated MIR171 reporter activity, with the gradient from red (maximum, 1.1 a.u.) to blue (none). e–h Confocal live imaging of the pMIR171B::H2B-GFP reporter in the SAMs of 35S::ATML1-GR plants, with the mock control (e, f) and the Dex treatment (g, h). Using identical imaging settings, the same SAM was imaged at 0 h and 24 h after the indicated treatment. Colors indicate quantified GFP intensities, and color bars represent fire quantification of signal intensity. Panels: (top) orthogonal view; (bottom) transverse optical section view from corpus. i–l Quantification of the gene expression for GFP (i), MIR171A (j), MIR171B (k), and HAM1 (l) in two independent 35S::ATML1-GR; pMIR171B::H2B-GFP transgenic lines (#5 and #9) 24 h after the mock or Dex treatment. Bars: mean ± SE. **P < 0.01, ***P < 0.001 (Student’s two-tailed t-test). n = 3 biological replicates. m, n Simulated HAM1 mRNA expression patterns in SAMs from the wild type control (m) and the plant with ectopic activation of ATML1(n). Color indicates the simulated HAM1 mRNA levels, with the gradient from red (at or above 2 a.u.) to blue (none). o, p RNA in situ hybridizations for HAM1 mRNA in the SAMs of 35S::ATML1-GR; pMIR171B::H2B-GFP plants 5 days after the mock (o) or Dex (p) treatment. One set of representative results are shown, and similar results from three independent biological replicates were obtained for each treatment. Scale bar: 50 µm (o–p). The template of a whole SAM was used for all the simulations, and only a half of the SAM is displayed for visualization of cells in inner layers. Source data underlying Fig. 7i–l are provided as a Source Data file.

