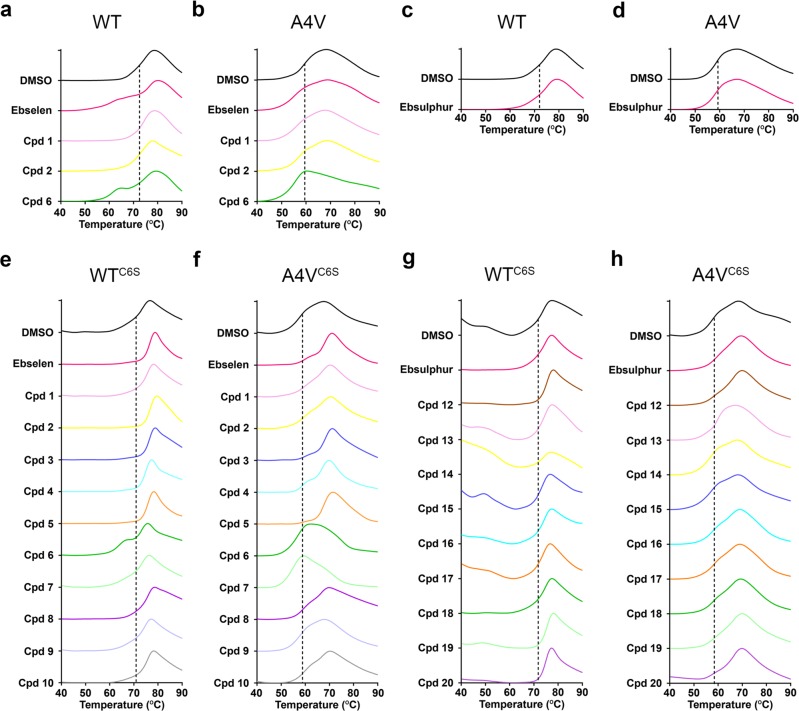
Fig. 2. DSF screening of the small molecules bound to SOD1.
Normalised melting curves of the wild-type (WT) and A4V SOD1 with and without (a, b) ebselen derivatives and (c, d) ebsulphur. Normalised melting curves of WTC6S and A4VC6S with and without ebselen derivatives (e, f) and ebsulphur derivatives (g, h). Each graph is an average of 3 independent experiments. Black dashed lines show the Tm (°C) of the control proteins: (a and c) WT SOD1; 72.4 °C, (b and d) A4V SOD1; 59.2 °C, (e and g) WTC6S SOD1; 70.7 °C, and (f and h) A4VC6S SOD1; 58.6 °C.

