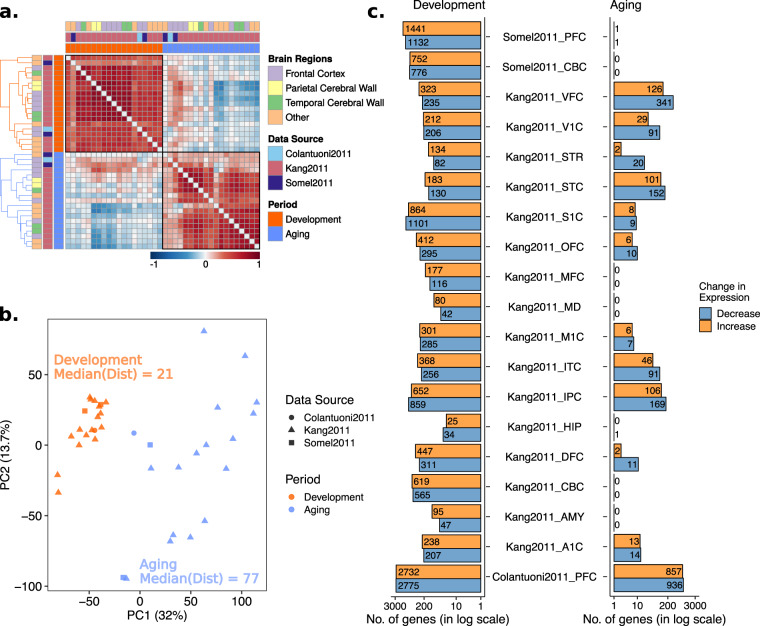
Figure 1.
Age-related change in gene expression during postnatal development and aging. (a) Spearman correlations among age-related expression changes (β values) across datasets. The color of the squares indicates if the correlation between the corresponding pair of datasets (across β values of 11,137 common genes) is positive (red) or negative (blue), while darker color specifies a stronger correlation. Diagonal values were removed in order to enhance visuality. Annotation rows and columns indicate data source, brain region and period of each dataset. Hierarchical clustering was performed for each period separately (color of the dendrogram indicates periods) to determine the order of datasets. (b) Principal component analysis (PCA) of age-related expression changes during aging and development. The analysis was performed on age-related expression change values of 11,137 common genes among all 38 datasets. The values of the first principal component on the x-axis and second principal component on the y-axis were drawn, where the values in the parenthesis indicate the variation explained by the corresponding principal component. Median Euclidean pairwise distances among development and aging datasets calculated using PC1 and PC2 were annotated on the figure. Different shapes show different data sources and colors show development (dark orange) and aging (blue) (c) Number of significant (FDR corrected p < 0.05) gene expression changes in development (left panel) and aging (right panel). The x-axis shows the number of genes in the log scale. The color of the bars shows the direction of change, decrease (steel gray), and increase (orange). The exact number of genes are also displayed on the plot.

