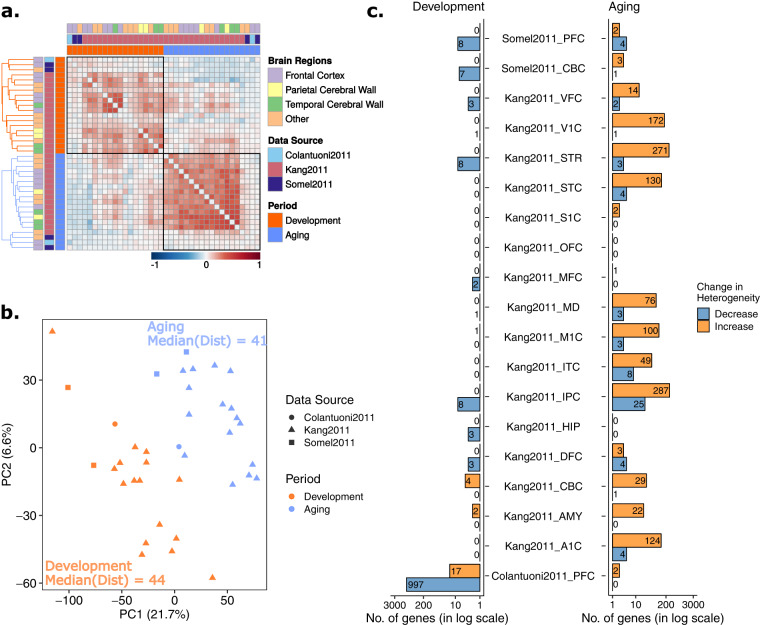
Figure 2.
Age-related change in gene expression heterogeneity during development and aging. The procedures are similar to those in Fig. 1, except, age-related heterogeneity changes (ρ values) were used instead of expression changes (β values). (a) Spearman correlations among age-related heterogeneity changes (ρ values) across datasets. (b) Principal component analysis (PCA) of heterogeneity change with age. (c) The number of genes showing significant heterogeneity change in aging and development.

