Figure 5.
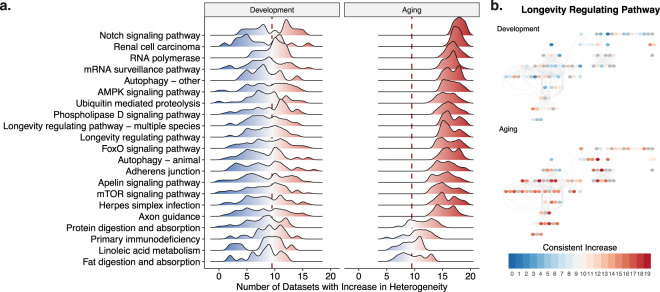
Functional analysis of consistent heterogeneity changes. (a) Distribution of consistent heterogeneity increase for the significantly enriched KEGG pathways, in development and aging. x- and y-axes show the number of datasets with a consistent increase and the density for each significant pathway, respectively. The dashed red line shows x = 9.5, which is the middle point for 19 datasets, representing no tendency to increase or decrease. Values higher than 9.5, shown with red color, indicate an increase in heterogeneity while values lower than 9.5, shown with blue color, indicate a decrease in heterogeneity and the darkness shows the consistency in change across datasets. (b) The longevity regulating pathway (KEGG Pathway ID: hsa04211), exemplifying the distribution of the genes (circles), their heterogeneity across datasets (color – the same color scheme as panel (a)), and their relationship in the pathway (edges). More detailed schemes for all significant pathways with the gene names are given as SI.

