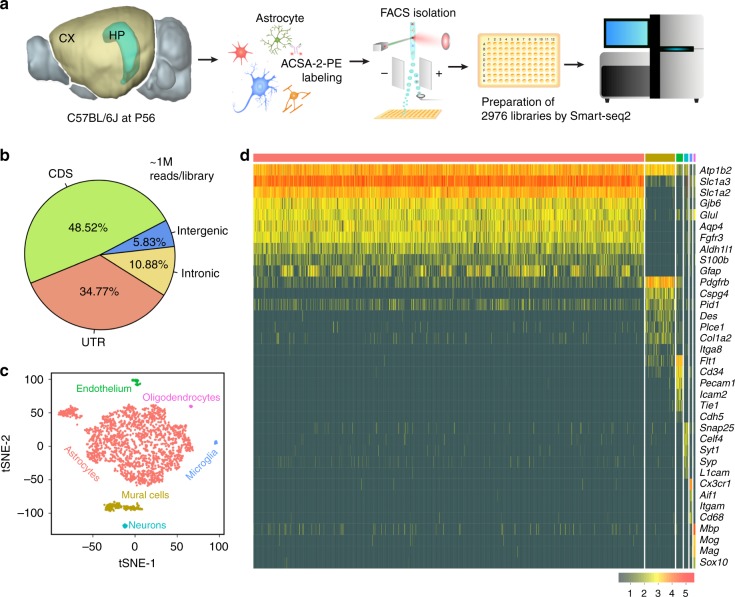
Fig. 1. Single-cell sequencing strategy and cell-type identification.
a Whole brains were obtained from C57BL/6J mice at postnatal (P) day 56. Cortical (CX) and hippocampal (HP) astrocytes were prepared separately, using enzymatic digestion followed by mechanical trituration. Two separate batches of astrocytes for each region were prepared. Cortical cell suspensions were prepared from two littermate animals in parallel using separate tubes. Hippocampal cell suspensions were also prepared in parallel using separate tubes; in this case, two different sets of four littermate animals were used. Astrocytes were then specifically labeled with the ASCA-2-PE antibody and single cells were deposited in individual wells of a PCR plate using FACS. Single-cell library preparation was performed using a modified Smart-seq2 protocol. In total, 2976 libraries were prepared and sequenced using a NextSeq 500 system (Illumina). b Each library was sequenced to optimal coverage (on average 1 M reads per library). In total, 2015 high-quality libraries were retained for further analysis. In these libraries, a high fraction of reads mapped to exons (CDS, coding sequence; UTR, untranslated region). Conversely, a low fraction of reads mapped to intronic and intergenic regions. c Visualization of the major higher-order cell types (2015 cells) identified by Seurat using tSNE plots. Each dot represents a single cell. Cells with similar molecular profiles group together; cell types were assigned according to the expression of specific marker genes (and are labeled in different colors). d Gene expression heatmap for higher-order cell types (columns) grouped according to the Seurat classification shown in Fig. 1c. Color-coding from Fig. 1c is retained. Gray, no expression; yellow, low expression; red, high expression, In-normalized gene expression data is shown.

