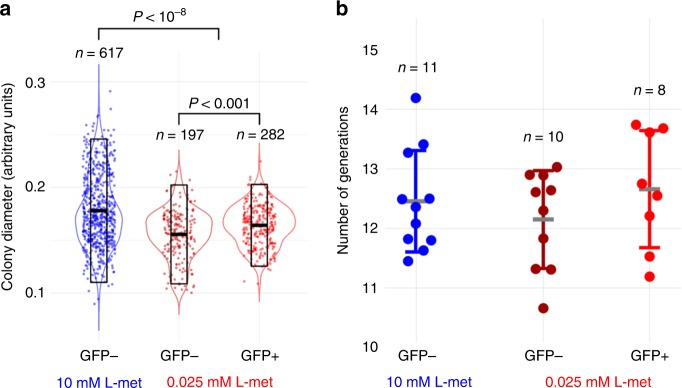
Fig. 3. The phenotypic states are inherited in long-term.
a Diameter of colonies on CDM-agar plates with high (10 mM) and low (0.025 mM) methionine concentrations. At high methionine concentrations, only GFP− colonies are observed (blue). At low methionine concentrations, both GFP− (dark red) and GFP+ (red) colonies are observed. Transparent boxes show mean and standard deviation. P < 10−8 (10 mM GFP− vs. 0.025 GFP−/GFP+), P < 10−3 (0.025 mM GFP− vs. 0.025 mM GFP+). Statistically significant based on two-tailed Mann–Whitney U test. b Number of generations in colonies as determined by flow cytometry. Although the number of generations inferred from the flow cytometry data in b follow the same trend as the colony diameter data in (a), differences were not significant (two-tailed Mann–Whitney test). Data are presented as mean ± S.D. Error bars represent standard deviation (SD).

