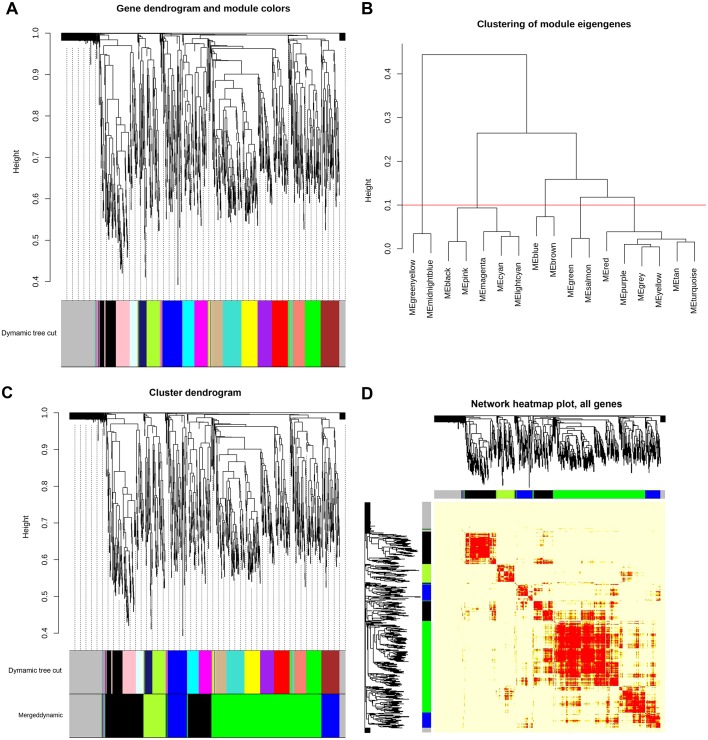
Figure 2.
WGCNA co-expression network and module detection analysis. (A) represents clustering dendrogram of genes with dissimilarity based on topological overlap. A total of 16 distinct modules are presented with different assigned colors in the horizontal bar below the dendrogram, with grey representing unassigned genes in any module. (B) Hierarchical clustering of 16 module eigengenes. The distance (1-TOM) is denoted by the y-axis and different MEs are denoted by the x-axis (labled as color with ME prefixed in each color module). The horizontal red line (1-TOM=0.10) depicts the benchmark for defining meta-modules. The green, blue, black and green-yellow modules illustrate meta-modules, while grey colored eigengenes were not assigned to any meta-module. (C) Original and merged co-expression modules with assigned original module colors and merged module colors. Genes were clustered based on a dissimilarity measure (1-TOM). The branches correspond to modules of highly correlated or interconnected groups of genes. Colors in the horizontal bar depict the modules before and after merging. Cluster dendrograms of genes with dissimilarity based on topological overlap is presented above the modules. A total of 16 original modules were merged to obtain 4 highly significant meta-modules denoted by the colors green, black, blue and green-yellow. Grey colored modules represent unassigned genes. (D) Heatmap plot of the weighted gene co-expression network. The plot indicates the TOM among all genes analyzed. Genes in columns and their corresponding rows are hierarchically clustered by cluster dendrograms, which are presented along the top and left side of the plot. Color-coded module membership is presented with colored bars (green, black, blue, green-yellow and grey) below and to the right of dendrograms. Green, black, blue and green-yellow colors signify the 4 significant meta-modules and grey represents the insignificant module. Progressively light and darker red colors in the matrix signify lower and higher overlap among genes. High co-expression interconnectedness are indicated by progressively more saturated yellow to red colors. TOM, topological overlap matrix; ME, module eigengene.

