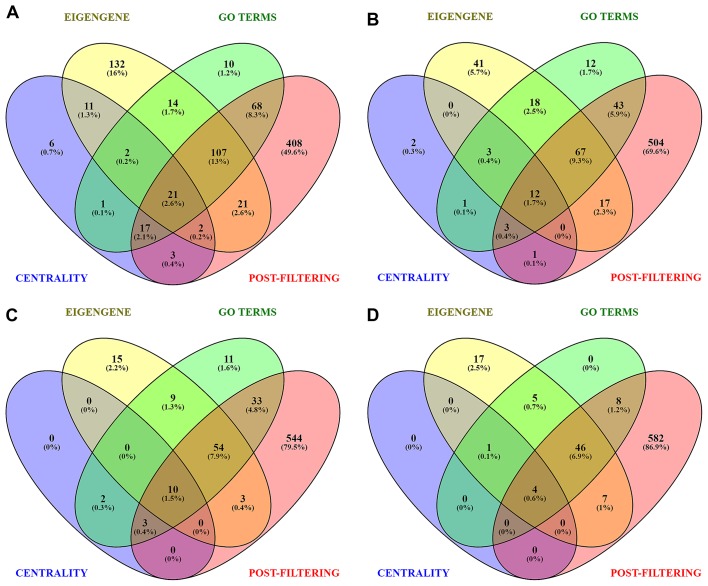
Figure 5.
Venn plots for Set-A, B, C and D. (A) Identification of signature genes using top ranked unique genes (Centrality set), significant GO terms (GO Terms set), eigengene based on principal component analysis correlation (Eigengene set) and Post-filtering set. The genes shared by all four sets revealed potent signature genes from (A) Module-1(21), (B) Module-2(12), (C) Module-3(10) and (D) Module-4(4). Blue represents centrality Set-A, green represents significant GO term Set-B, yellow represents eigengene Set-C and red represents post-filtering Set-D. GO, gene ontology.

