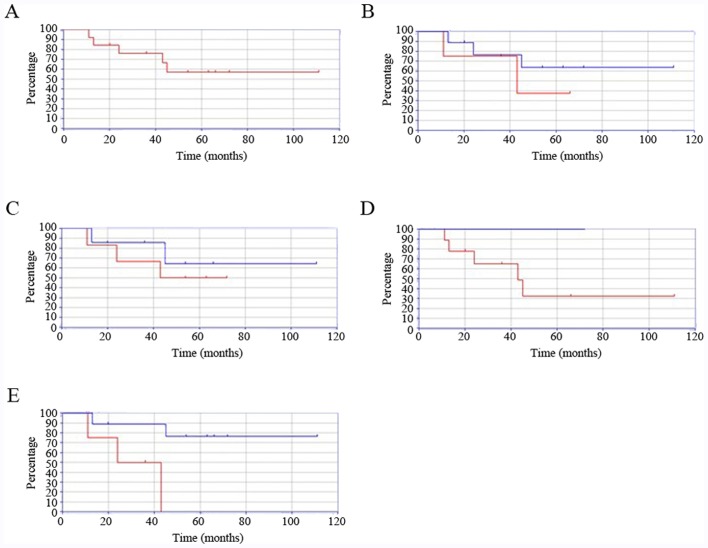
Figure 3.
Kaplan-Meier curves showing survival rates in various groups. (A) Survival rates in adolescents and young adults with sarcoma according to age. (B) Survival rates in patients with sarcoma who were 15-29 years (red line) vs. those who were 30 years of age and older (blue line). Survival was poorer in patients with sarcomas of 15-29 years of age. There was no significant difference between these age groups (P=0.43). (C) Survival rates in adolescents and young adults with soft tissue sarcomas (red line) vs. bone sarcoma (blue line). Survival rates were similar in patients of both groups. There was no significant difference according to sarcoma type (P=0.53). (D) Survival rates of adolescents and young adults with high-grade (red line) vs. low-grade sarcoma (blue line). Survival was significantly poorer in the high-grade sarcoma group (P<0.001). (E) Survival rates in adolescents and young adults with sarcomas of the trunk (red line) vs. extremities (blue line). Survival was significantly poorer in patients with sarcomas of the trunk (P=0.017).

