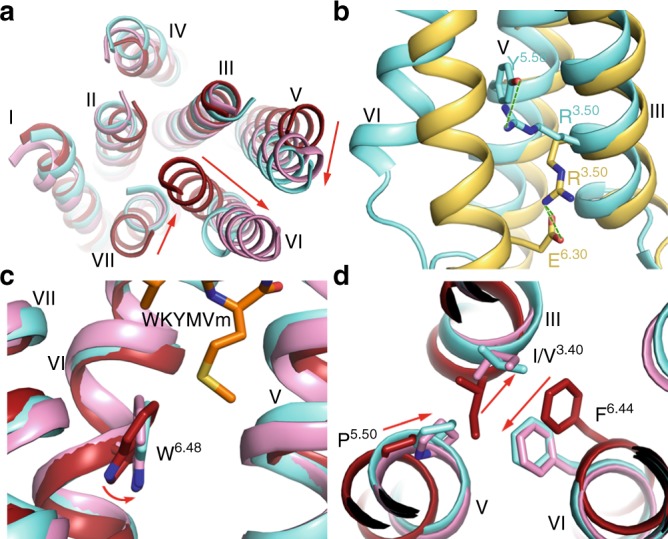
Fig. 2. Active conformation of the FPR2-WKYMVm complex.

a The movement of helix VI. The transmembrane helical bundles in the structures of FPR2-WKYMVm (cyan), μOR-BU72 (pink, PDB code: 5C1M) and μOR-naloxone (dark red, PDB code: 4DKL) are shown in cartoon representation at an intracellular view. The red arrows indicate the movements of helices V, VI, and VII in the FPR2-WKYMVm and μOR-BU72 (active) structures relative to the μOR-naloxone (inactive) structure. b The hydrogen bond interaction between R3.50 and Y5.58 in FPR2. The FPR2 residues R3.50 and Y5.58 are shown as cyan sticks. The inactive A1AR-DU172 structure (PDB code: 5UEN) is shown in yellow cartoon representation. The A1AR residues R3.50 and E6.30 that form a salt bridge are shown as yellow sticks. The polar interactions are shown as green dashed lines. c The conformational change of W6.48. The structures of FPR2-WKYMVm (cyan), μOR-BU72 (pink), and μOR-naloxone (dark red) are shown as cartoons. The residue W6.48 in the three structures is shown as sticks. The red arrow indicates the movement of W6.48 side chain in the FPR2-WKYMVm and μOR-BU72 (active) structures relative to the μOR-naloxone (inactive) structure. d The conformational change of the P5.50I/V3.40F6.44 motif. The residues at positions 3.40, 5.50, and 6.44 in the structures of FPR2-WKYMVm (cyan), μOR-BU72 (pink), and μOR-naloxone (dark red) are shown as sticks. The red arrows indicate the relocations of these residues in the FPR2-WKYMVm and μOR-BU72 (active) structures relative to the μOR-naloxone (inactive) structure.
