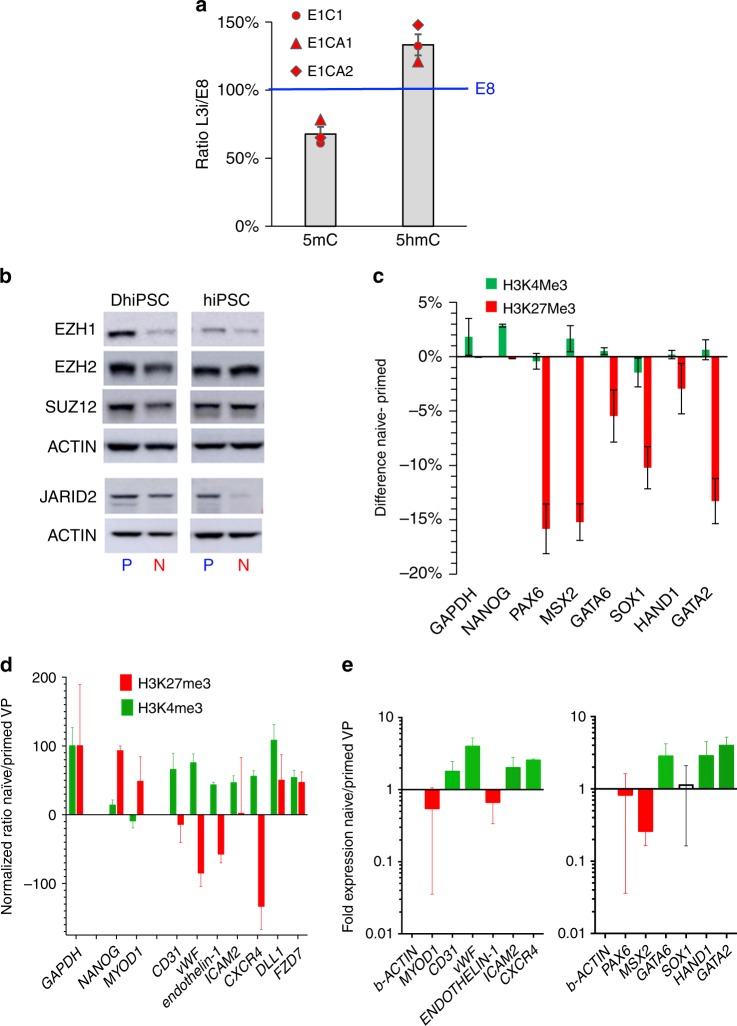
Fig. 9. Epigenetic configuration of bivalent and vascular-lineage-specific promoters in primed vs. naïve hiPSC and VP.
a Densitometric quantitation of dot immunoblots of genomic DNA samples for global levels of 5-methylcytosine (5mC) and 5-hydroxymethylcytosine (5hmC) in three isogenic pairs of primed vs. naïve DhiPSC. Immunoblot naïve/primed densitometric ratios were determined with ImageJ software at steady state conditions (200 ng), and normalized at 100% for E8 values. b Western blot analysis of PRC2 components (EZH1, EZH2, SUZ12, and JARID2) in primed vs. naïve normal (C1.2) and diabetic (E1C1) hiPSC lysates. c ChIP-qPCR for H3K27me3 and H3K4me3 histone marks at bivalent developmental promoters (e.g., PAX6, MSX2, GATA6, SOX1, HAND1, GATA2) in primed vs. naïve DhiPSC (E1C1). GAPDH and NANOG are controls for actively-transcribed genes. Data are presented as differences in percent input materials of naïve minus primed genomic DNA samples. Error bars represent the SEM of replicates. d ChIP-qPCR for H3K27me3 and H3K4me3 histone marks at vascular developmental promoters in primed vs. naïve VP genomic samples. Data are presented as GAPDH-normalized ratios of percent input materials between naïve and primed VP differentiated from DhiPSC (E1C1). Results are shown as ratios of expression of isogenic N-DVP vs. DVP for GATA2-regulated genes (CD31, vWF, endothelin-1, ICAM2) and genes regulated by histone marks that are known to effect vascular functionality (CXCR4, DLL1, FZD7). GAPDH served as housekeeping control gene; NANOG and MYOD1 represented control promoters that are normally repressed during vascular differentiation. e qRT-PCR gene expression analysis of vascular-lineage genes (left panel) and PRC2-regulated lineage-specific genes (right panel) in DVP vs. N-DVP that were differentiated from isogenic pairs of naïve vs. primed D-hiPSC (n = 3; E1C1, E1CA1, E1CA2). Fold changes are normalized to beta-actin expression.

