
Figure 1:
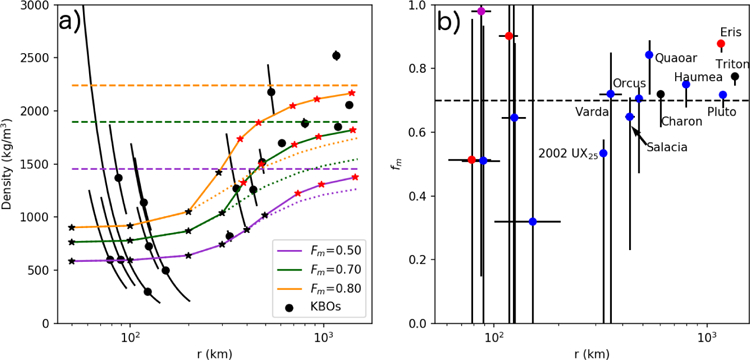
a) Density of observed KBOs with 1σ errors in black. Error bars only account for uncertainty in radius. See Table A.2 for citations. Each color refers to a fixed rock mass fraction indicated in the legend. Flat dashed lines show the density of a non-porous object. Dotted line shows the expected density only accounting for brittle failure. Solid lines show model results that include the effects of thermally controlled viscous relaxation. Individual model runs are show with stars. Red stars indicate models where internal temperatures met or exceeded 250 K at some point. All thermal models were started at 10 Myr to avoid the effects of 26Al decay (See Figure 2). b) Estimated rock mass fraction of each KBO by interpolating model runs. Horizontal line is fm = 0.7. Colors indicate object class where blue are classical and resonant KBOs, red is scattered disk object, magenta is centaur, and black are satellites. The upper fm limit is the interpolated model value using the 1σ density upper bound. The lower fm limit is the fm calculated assuming no porosity and the 1σ density lower bound.