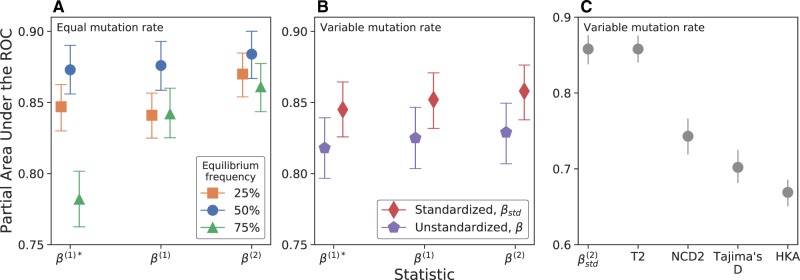
Fig. 1.
—Partial area under the receiver operator curve (ROC) from a false positive rate of 0 to 0.05 in simulations for each statistic under (A) different equilibrium frequencies and (B) with mutation rate variation, where one half of neutral and balanced simulation replicates had a mutation rate of (our default rate), and the remaining half had a rate of . (C) Power of compared with other methods for detecting balancing selection. An equilibrium frequency of 50% was used for (B) and (C). The values of each statistic were compared between simulations containing only neutral variants (True Negatives) or with a balanced variant (True Positives). Confidence intervals show the 2.5th to 97.5th percentile for 1,000 sets of bootstrapped simulation replicates.

