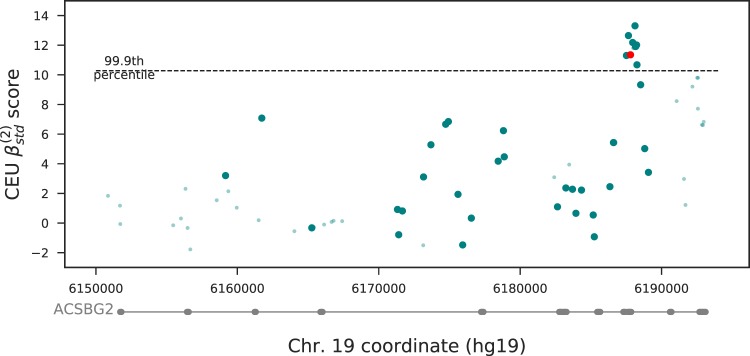
Fig. 2.
—The ACSBG2 locus shows evidence of balancing selection in the CEU population. The red dot indicates two missense mutations. The large circles indicate SNPs at the frequency of the putatively balanced haplotype, whereas the small circles indicate SNPs at other frequencies. Only SNPs passing our filtering for quality are plotted.

