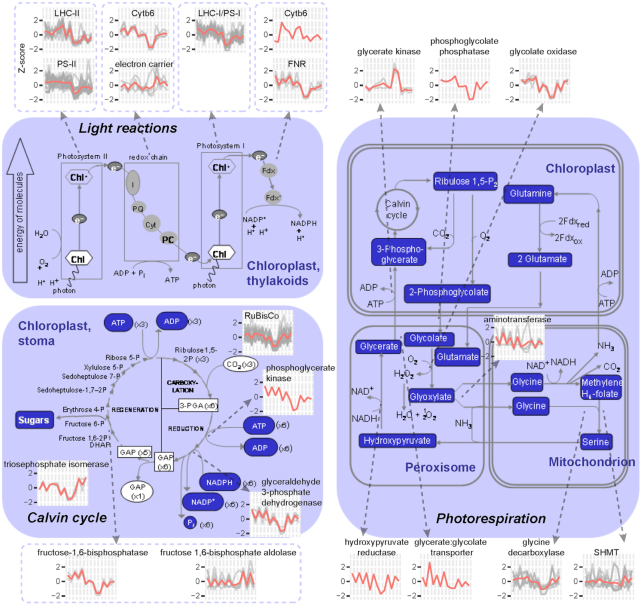
Figure 3:
Schematic representation of gene expression patterns in the photosynthesis pathway. The figure was modified on the basis of the MapMan visualization platform. Line plots represent Z-score–normalized (y-axis) expression patterns of DEGs under various light quality and light intensity conditions. The x-axis from left to right represents the samples of WL_Dawn, WL_Dusk, BL_Dawn, BL_Dusk, RL_Dawn, RL_Dusk, FRL_Dawn, FRL_Dusk, DG_Dawn, DG_Dusk, LL_Dawn, LL_Dusk, HL_Dawn, and HL_Dusk. Detailed gene list and expression data are presented in Supplementary Table S4. ADP: adenosine diphosphate; ATP: adenosine triphosphate. Fdx: ferredoxin. GAP: Glyceraldehyde 3-phosphate. PGA: 3-phosphoglycerate.

