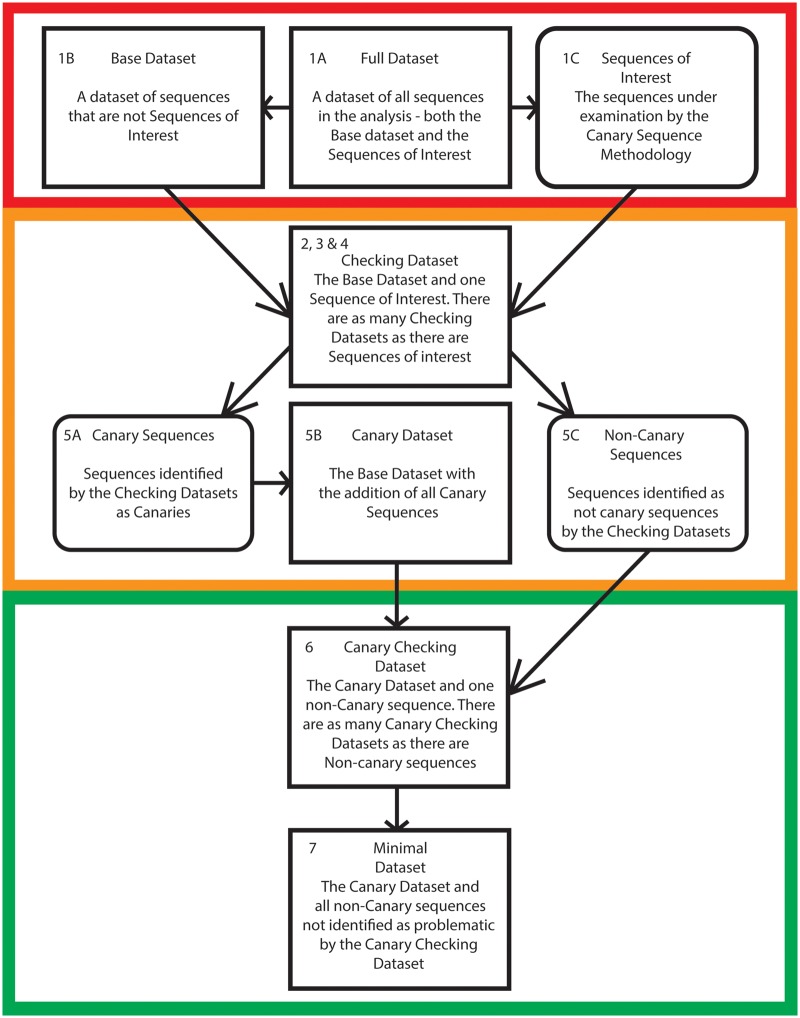
Fig. 2.
—A flowchart illustrating the key steps in the canary sequence approach. The first stage of the methodology (Red), shows how sequences are classified as members of the base data set or sequences of interest. In the second stage (Orange) sequences are assessed using checking data sets to determine whether or not they are canary sequences. In the fianl stage (Green) noncanary sequences are assessed using canary checking data sets to generate a minimal dataset and its associated minimal tree. Stages are numbered with reference to the steps in the pipeline described in the “The Canary Sequence Approach to Identify Problematic Sequences” section of this paper. A more detailed description of the methodology is available in supplementary figure S1, Supplementary Material online.

