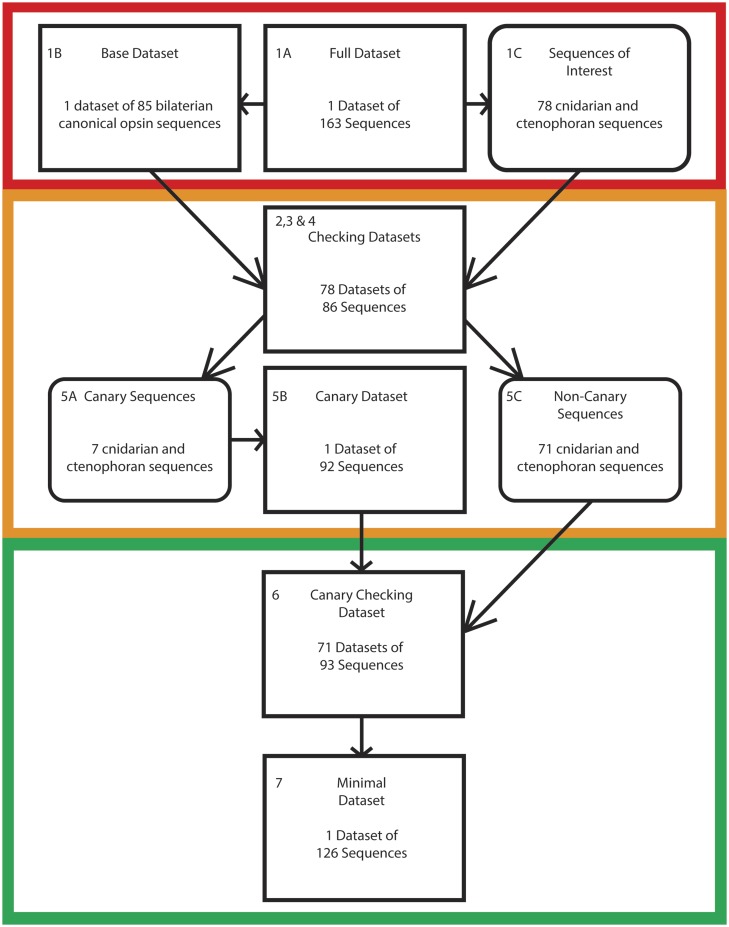
Fig. 3.
—The canary sequence methodology applied to the opsin data set. The number of sequences at each stage of the canary sequence approach, when applied to the nonbilaterian opsin sequences. Each stage is color-coded to correspond to the stages depicted in figure 2.

