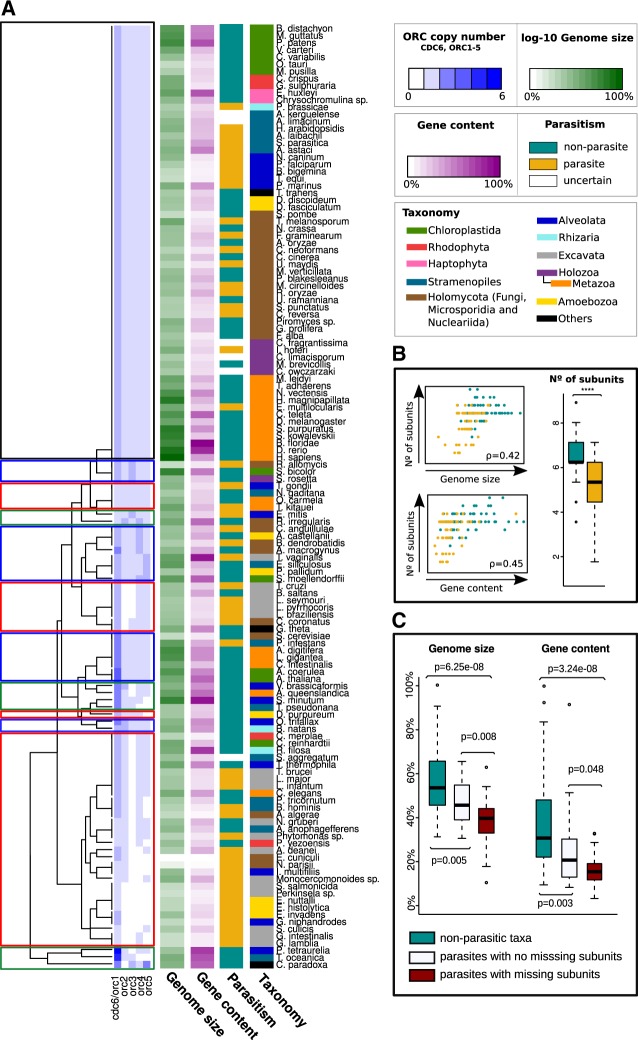
Fig. 3.
—(A) Clustering of eukaryotic taxa according to ORC subunits counts (see Supplementary Information Methods, Supplementary Material online). In the heatmaps, Genome size (GS) metrics were normalized to the largest genome in euk_db after being converted into base-10 log scale. Gene content (GC) metrics were also normalized to the largest number of sequences in euk_db. (B) On the left, scatter plots illustrating the correlation between total CDC6+ORC1-5 counts and genome size and gene content metrics. Dots are colored according to species lifestyle (parasite or nonparasite). Spearman’s correlation coefficients (ρ) are also represented. On the right, the distribution of total CDC6+ORC1-5 counts in parasitic and nonparasitic taxa (Mann–Whitney U test P-value = 1.165e–05). (C) Distribution of genome size and gene content metrics for nonparasitic taxa, parasites with no missing ORC subunits, and parasites with missing subunits. Mann–Whitney U test P-values (P) are indicated.

