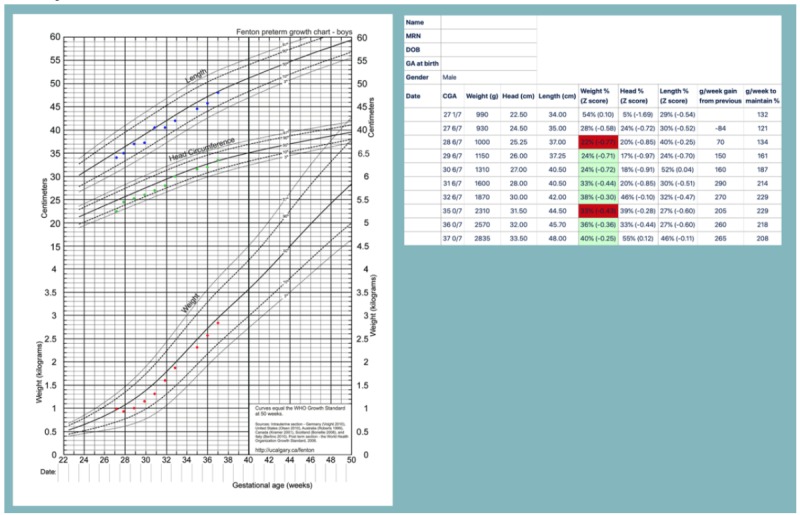
Figure 4.

Electronic Fenton 2013 preterm growth chart. De-identified demographic and anthropometric data is copied into a webpage form from a specifically designed Microsoft Excel™ spreadsheet. The upper panel shows each anthropometric measurement plotted automatically onto the traditional paper-based chart. The lower panel displays calculated percentiles, Z-scores, and weekly weight change, both the actual observed change as well as the expected weekly change needed to maintain the previous percentile. Clinical decision support is provided by color-coding based on the weekly weight Z-score change.
