
Figure 5.
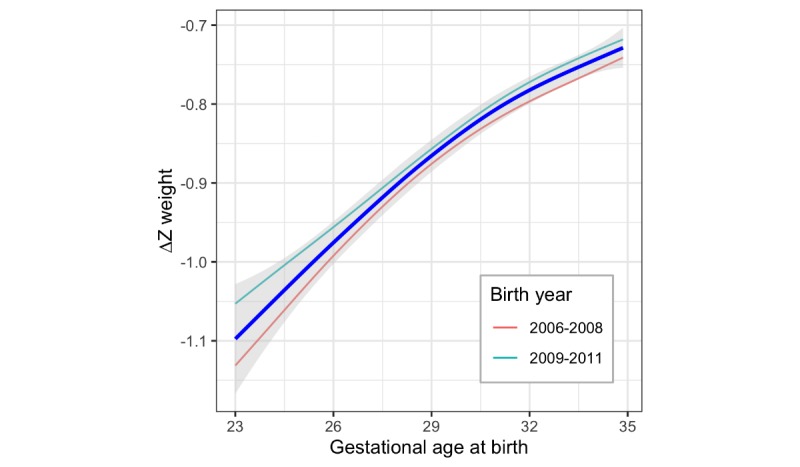
Change in weight Z-score from birth to discharge versus gestational age at birth, demonstrating inferior growth with increasing prematurity for all seven NICUs combined. The dark blue line is for all years 2006 - 2011 combined with the gray band representing the 95% confidence interval; the thin lines show the grouped birth years 2006 - 2008 versus 2009 - 2011.