
Figure 4.
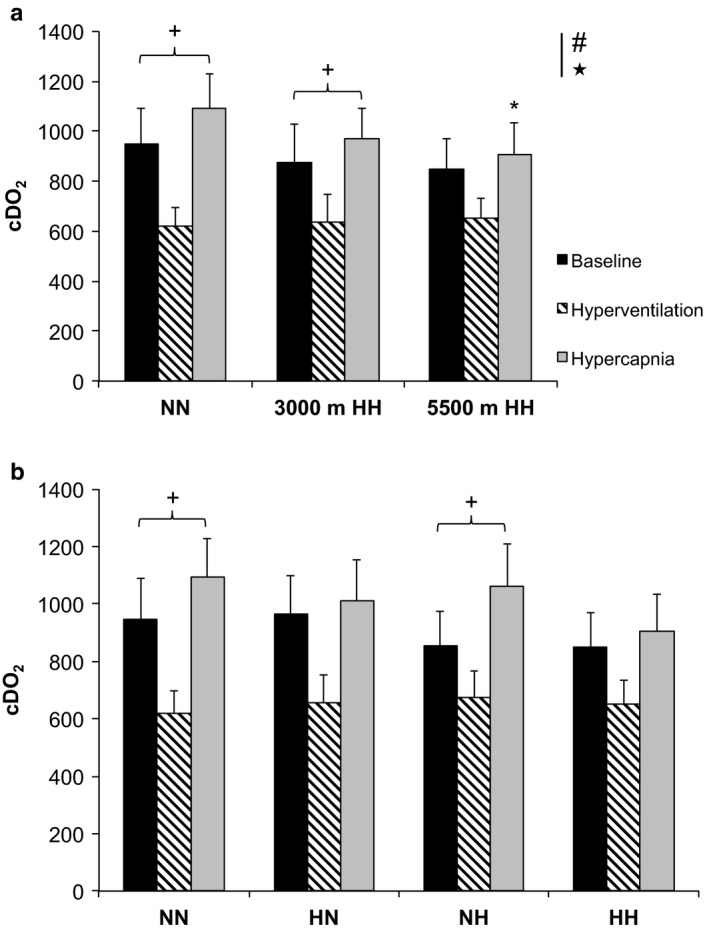
Cerebral oxygen delivery (cDO2, absolute values) of all subjects (n = 9), Mean ± SD. (a) Normobaric normoxia (NN) and hypobaric hypoxia (HH) conditions at 3,000 m and 5,500 m. (b) NN; normobaric hypoxia (NH); hypobaric hypoxia (HH), and hypobaric normoxia (HN) conditions. Left histograms represent cDO2 baseline values, middle cDO2 during hyperventilation, and right cDO2 at the end of hypercapnia. # p < .05 for difference between baseline and hyperventilation values in all conditions; ★ p < .05 for difference between hyperventilation and hypercapnia values in all conditions; + p = .014, + p < .05 for difference with baseline values; and *p = .046 for difference with NN during hypercapnia