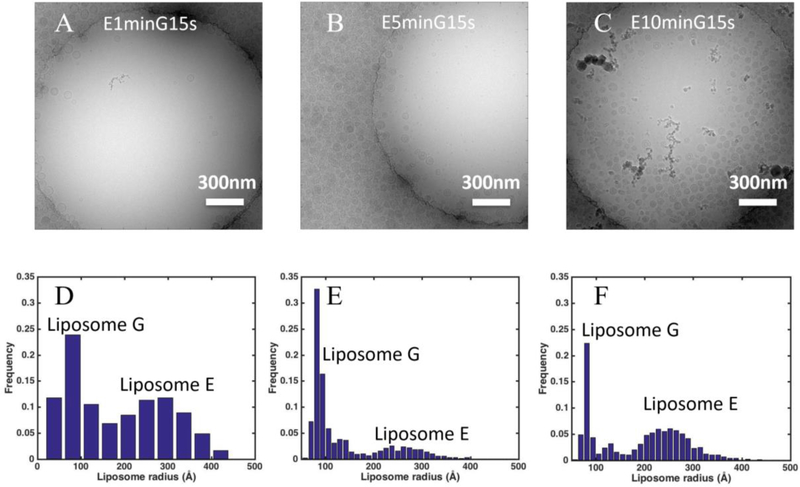
Figure 4.
Contributions of the first and second application of samples on liposome density in holes on a holey-carbon grid. (A-C) Representative cryo-EM images prepared with 1 minute, 5 minutes, and 10 minutes incubation of Liposome E followed by one application of Liposome G. (D-F) Size distributions of liposomes in holes (2 μm in diameter) from cryo-EM images prepared as shown in A-C. Scale bar: 300 nm. Analysis was based on 5, 10, and 5 images, 46, 321, and 482 liposomes for D, E and F, respectively.

