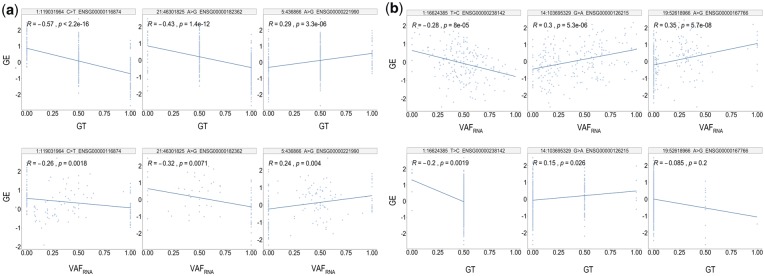
Fig. 5.
(a) eQTL-exclusive correlations (top) and their corresponding ReQTLs (bottom). The plots represent correlations from SkN. The available number of genotypes for the eQTL computation is 243 for all three SNVs (i.e. genotypes were available for all of the samples), while VAFRNA values were present in 151 (62.1%) for the 1: 119031964_C > T locus, 186 (76.5%) for the 21: 46301825_A > C locus and 173 (71.2%) for the 5: 436866_A > G locus. (b) ReQTL-exclusive correlations (top) and their corresponding eQTLs (bottom). The examples show: (left) an SNV with a low number of homozygous genotype calls (1: 16624385_T > C, average heterozygosity in the human population: 0.494 ± 0.055); (middle): an SNV with relatively low number homozygous variant genotype calls (chr14: 103695329_G > A, average heterozygosity in the human population: 0.362 ± 0.224); (right) an SNV with relatively low number heterozygous and homozygous variant genotype calls (chr19: 52618966_A > G, average heterozygosity in the human population 0.294 ± 0.246). All the P-values are calculated based on the input for the plot and do not represent the ReQTL/eQTL FDR—corrected values

