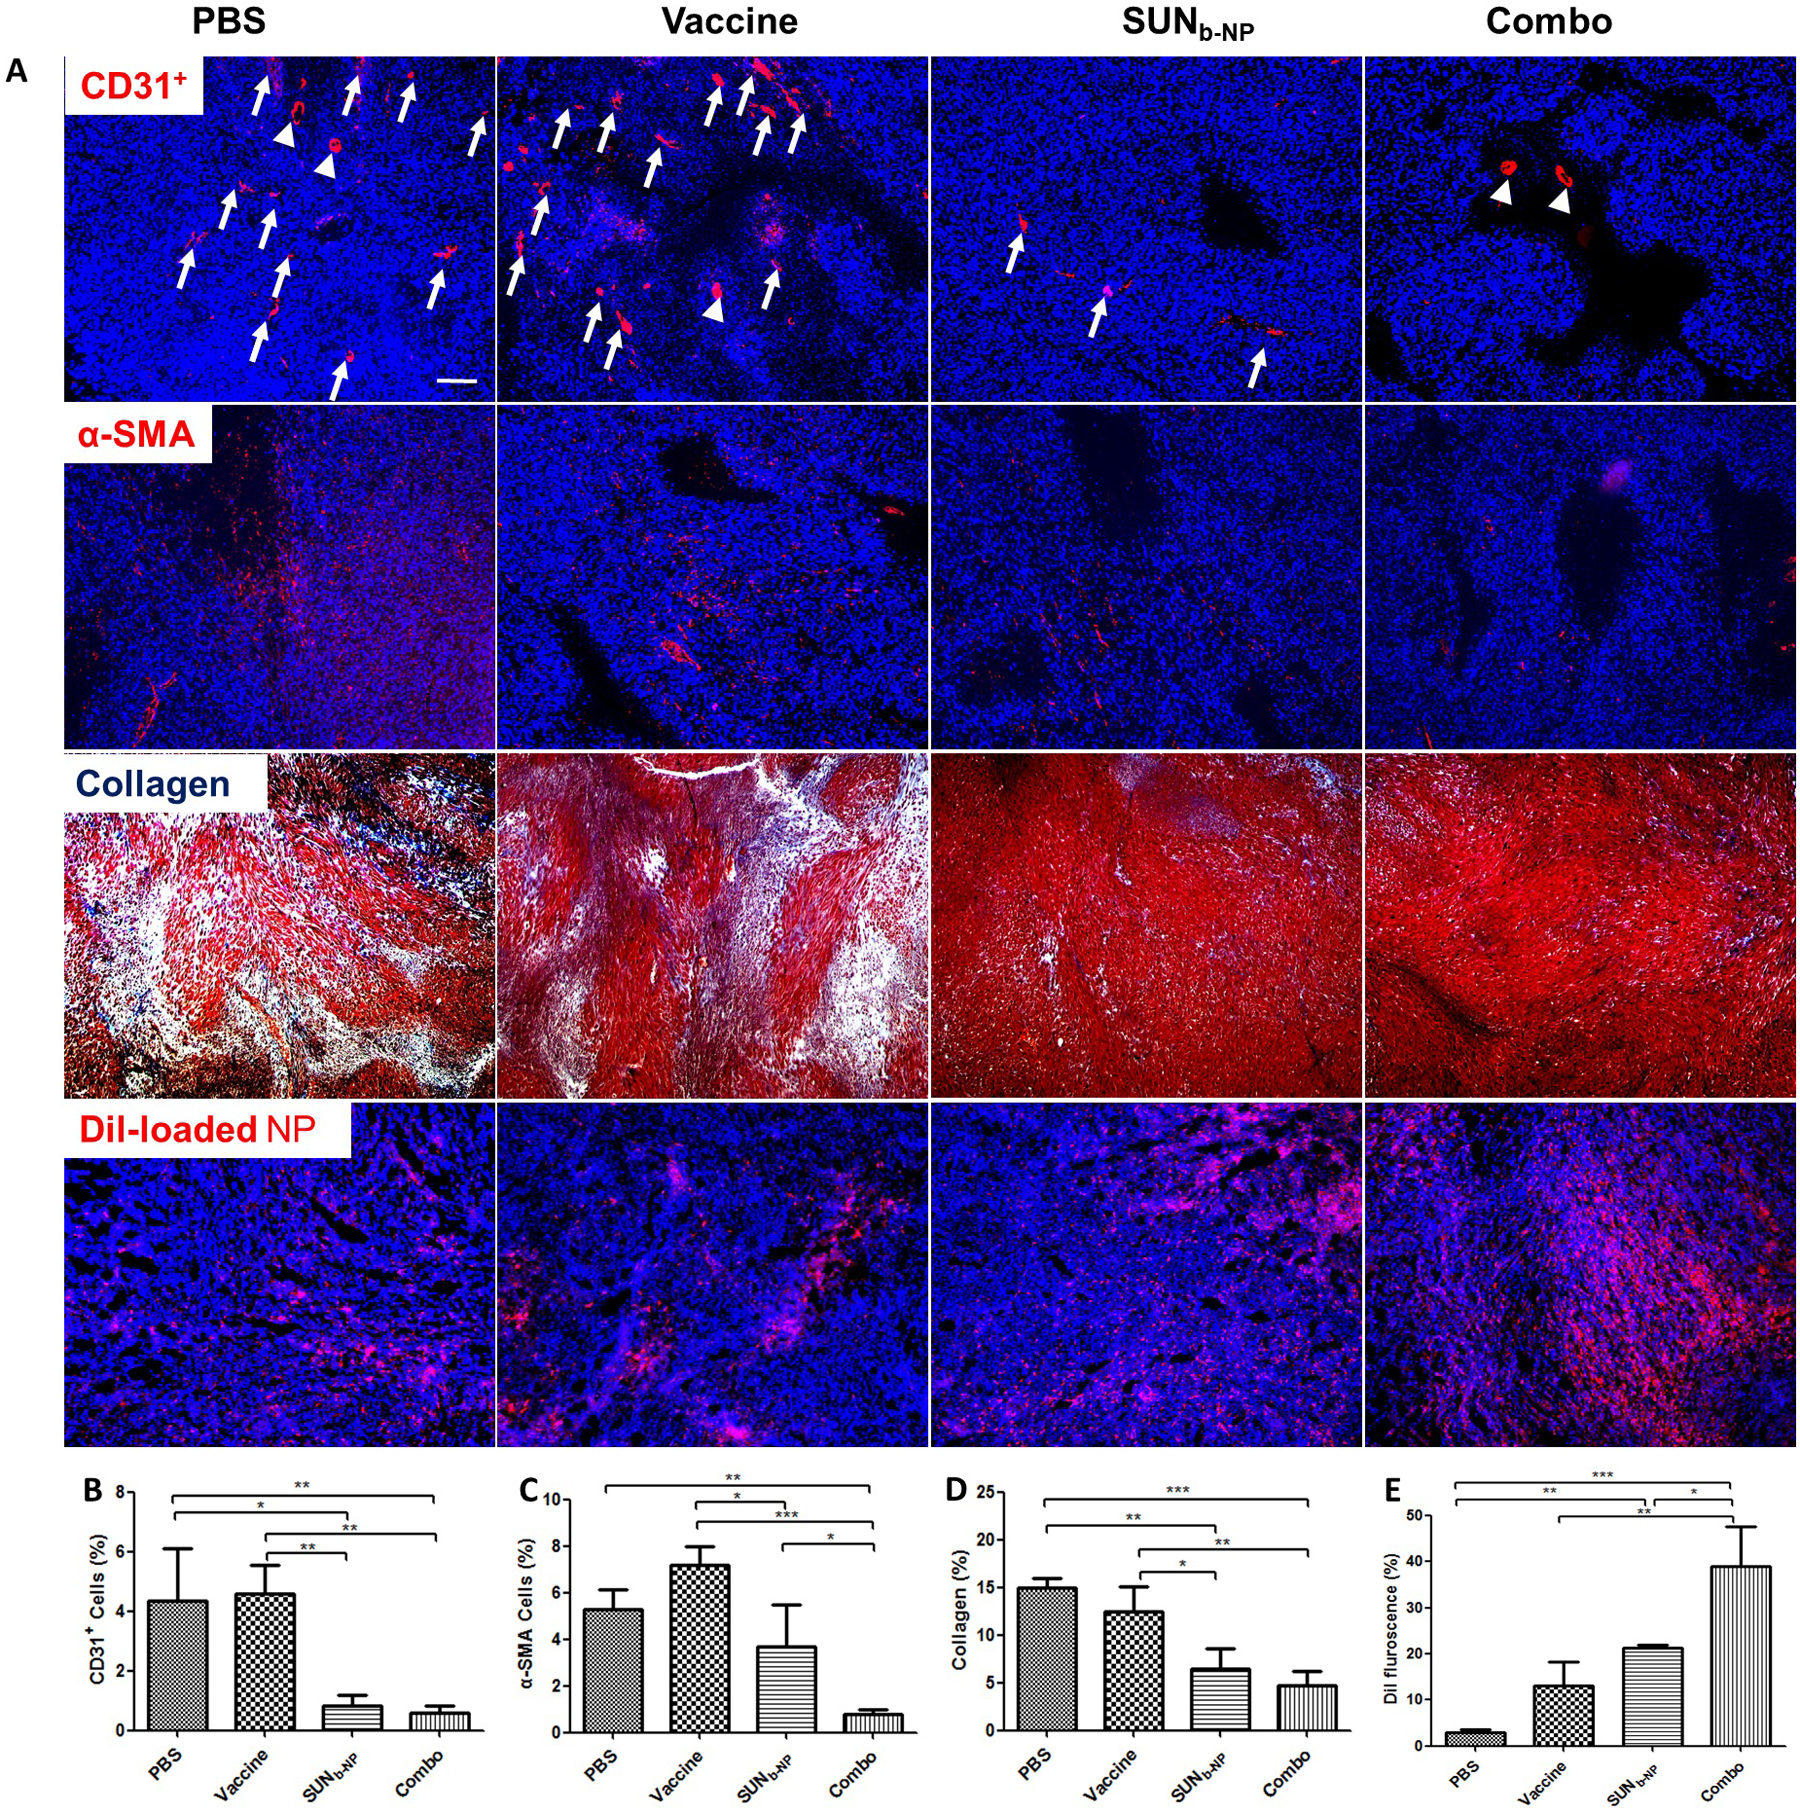
fig. 3.

structure changes in tme. the tumor sections from murine dm model after treatment in different formulations were stained. (a) cd31+ antibody (red) visualized tumor vasculature (1st row, arrows and arrowheads indicated the elongated vessels or round vessels, respectively); α-sma antibody (red) characterized tafs in tumors (2nd row); collagen fibers was stained with masson’s trichrome (blue, 3rd row); tumor permeability of dil-loaded np (red, 4th row). dapi (blue) stained the cell nuclei, and the white scale bar represents 200 μm. to quantify the data in the images, three selected randomly images were analyzed using image j (b, c, d and e, respectively). *p <0.05, **p < 0.01, ***p < 0.001.
