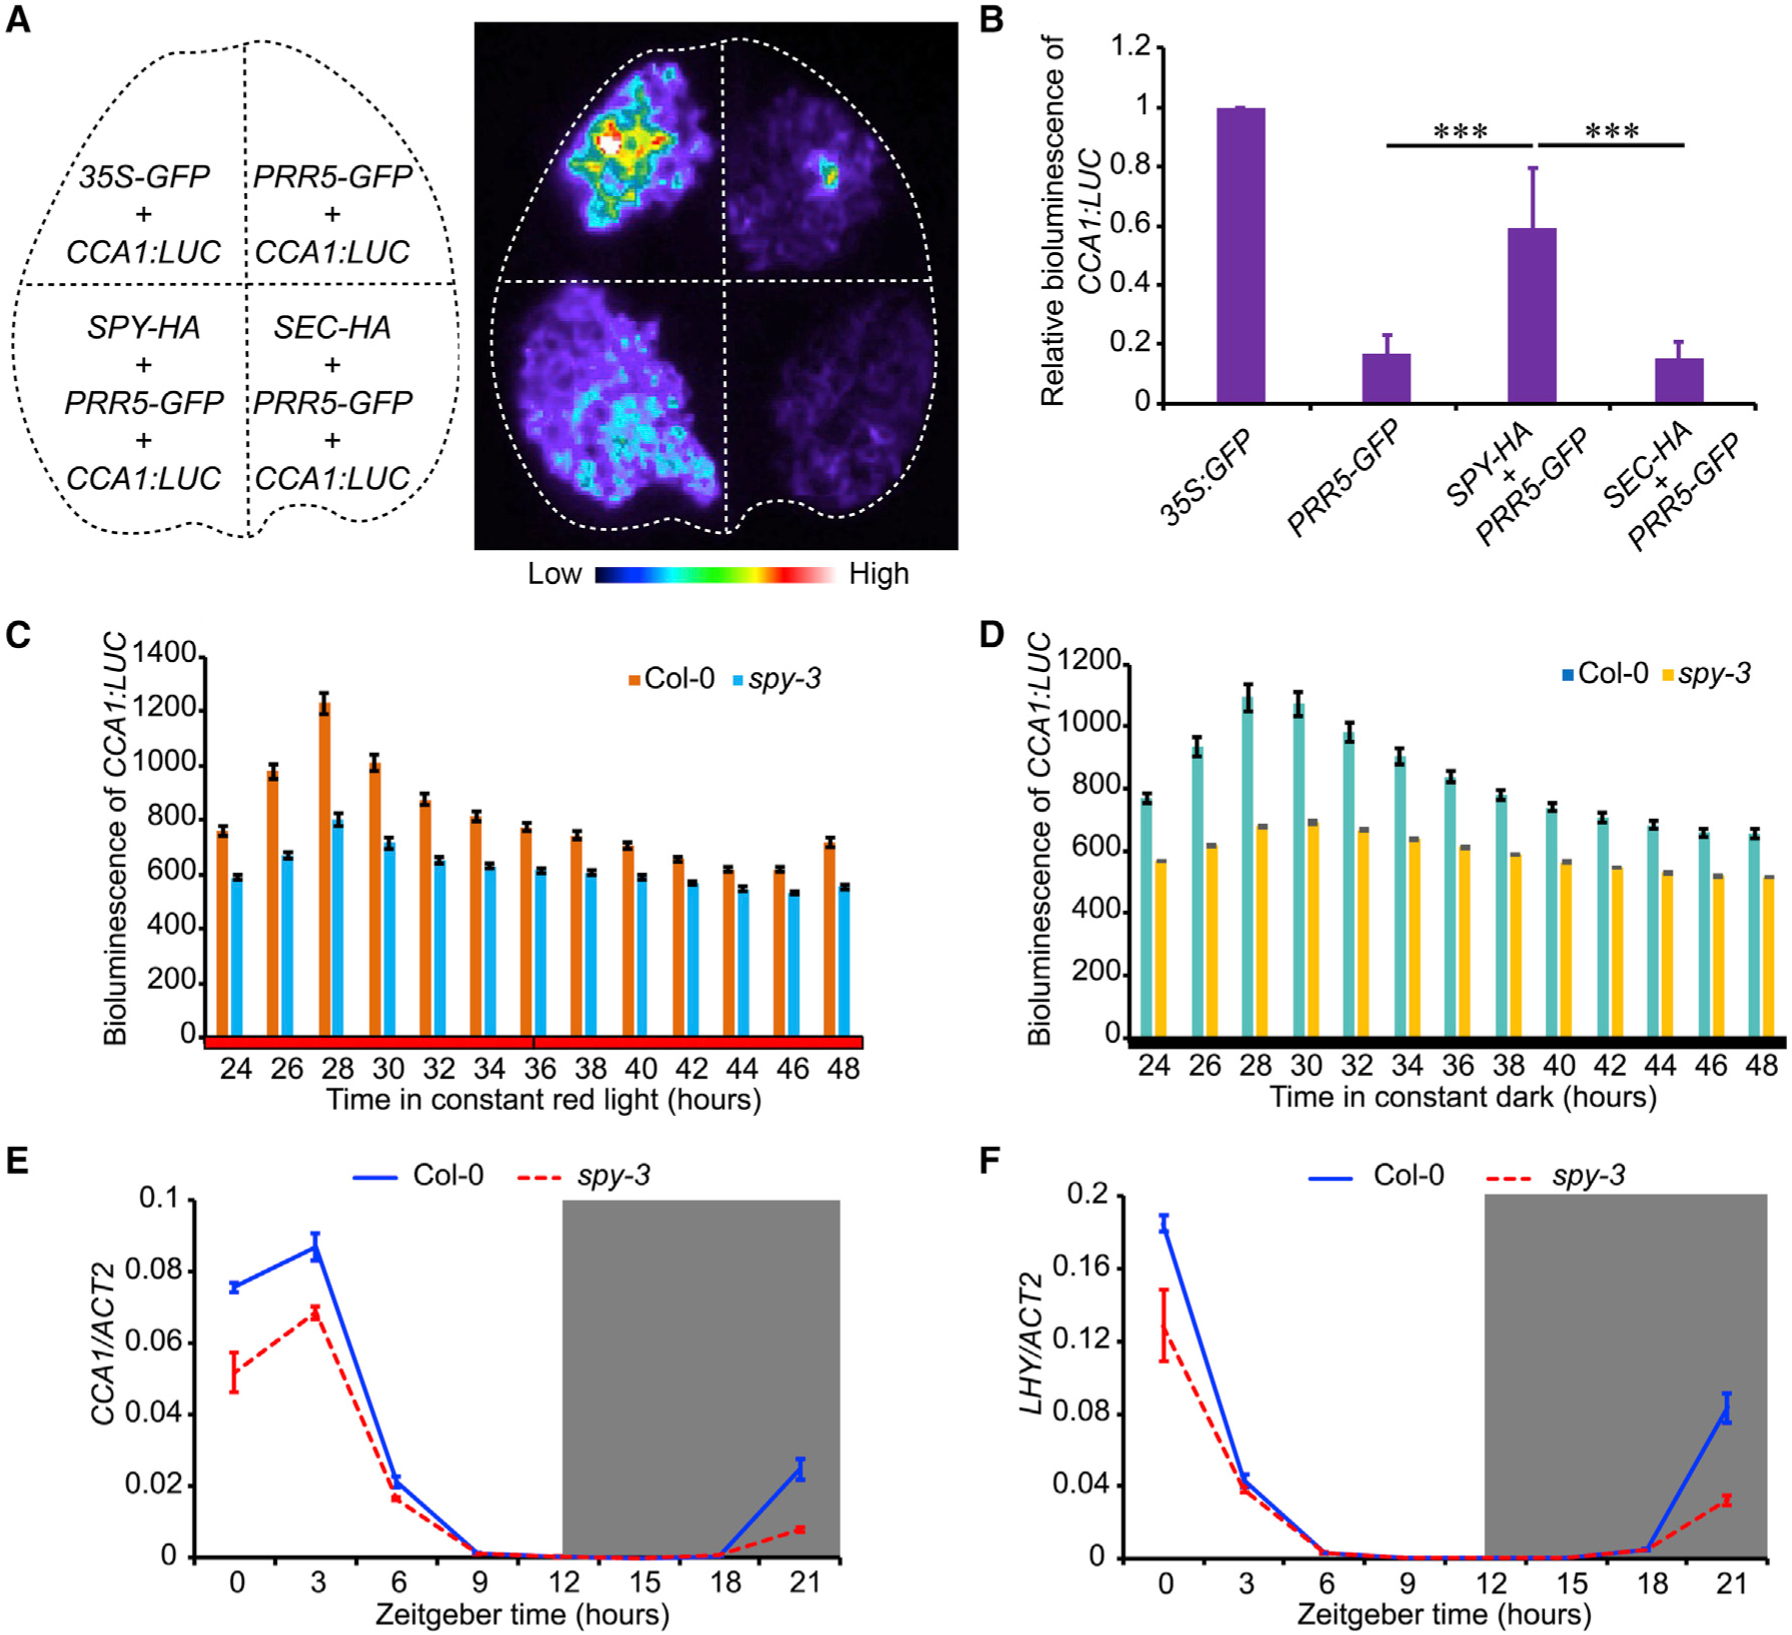
Figure 5. The Abundance of the Transcripts of CCA1 and LHY Are Regulated by SPY.

(A) Bioluminescence of CCA1:LUC in transiently transformed N. benthamiana leaves with indicated constructs shown in left panel. 35S:GFP was used as an effecter control.
(B) Quantitative analysis of bioluminescence intensity shown in A. Data represent mean ± SE. (n = 6). ***p < 0.001 (Student t-test).
(C and D) Bioluminescence of CCA1:LUC showing the lower transcription level of CCA1 in spy-3 in continuous red light or continuous darkness as denoted. Data represent mean ± SE (n = 15).
(E and F) Transcript levels of CCA1 (E) and LHY (F) in spy-3 mutant under LD condition. Data represent mean ± s.e. in three biological replicates. The gene expression level was normalized by ACT2 expression.
