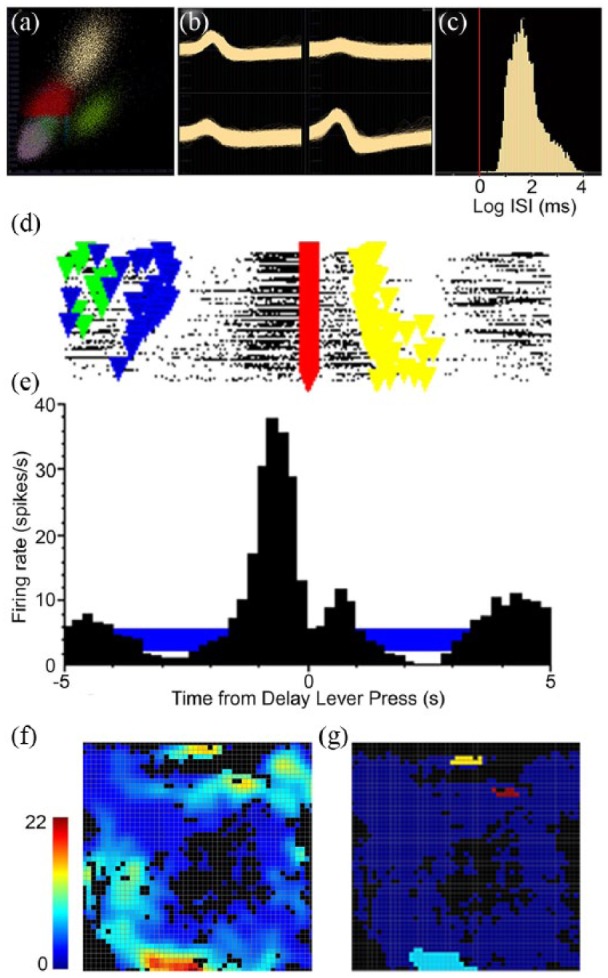
Figure 2.

Example from one neuron of single unit electrophysiological analyses. Criteria for identifying isolated neurons included a well-defined cluster in the 3D plot (a), distinct waveforms recorded by different microwires in a tetrode (b), and a minimum interspike interval above 1 ms with an interspike interval histogram peaking above 10 ms (c). Examples are shown of a raster plot (d) and peri-event time histogram (PETH) (e) aligned with the delay lever press. Triangular event markers in the raster indicate start (green), sample (blue), delay (red), and choice (yellow) lever presses. The horizontal blue bar shows the 99% confidence interval for the PETH. The criterion for an event-related response was a PETH beyond the 99% confidence interval for two consecutive time bins with consistent changes in activity for at least 20% of trials in the raster plot. Spatial coding properties were characterised by heat maps (f) colour coded to show activity in spikes/s and firing fields (g) indicating areas reaching the criterion of a minimum of 9 contiguous bins with activity 3 standard deviations above the mean. This cell was classified as spatially restricted movement 1 since 2 of the 4 pathways traversed during movements between levers were not associated with firing fields.
