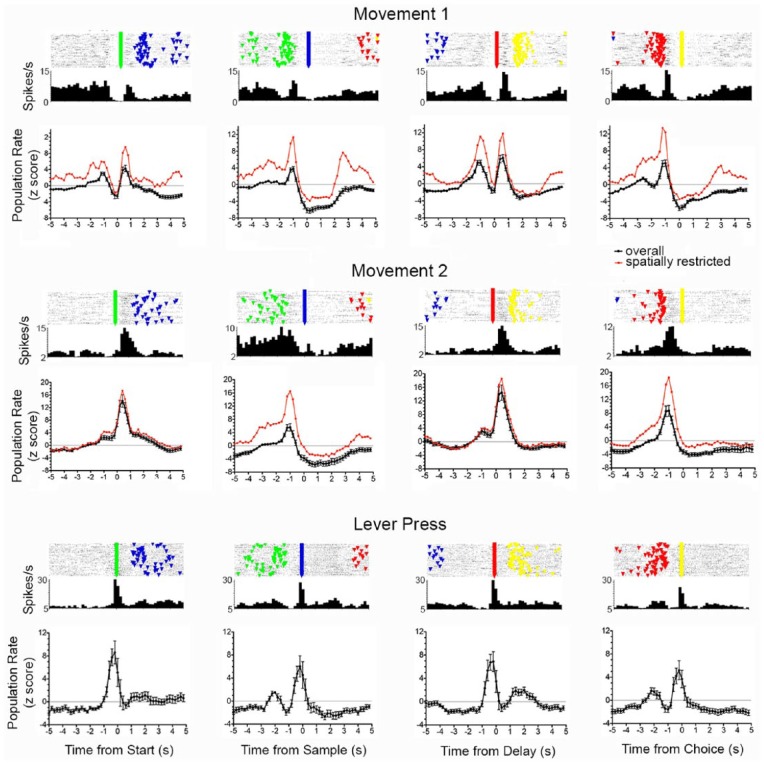
Figure 4.
Normalised population responses aligned with start, sample, delay, and choice responses for neurons exhibiting movement 1 (n = 97), movement 2 (n = 32), and lever press (n = 28) responses. PETH and raster plots are shown for the neuron with the median correlation to the normalised population average. Normalised population averages are shown for the overall population (black, error bars represent standard error of the mean) and for neurons classified as spatially restricted (red). Event markers in raster plot represent start (green), sample (blue), delay (green), and choice (yellow) lever presses in each dDNMTP trial (with trial 1 at bottom).

