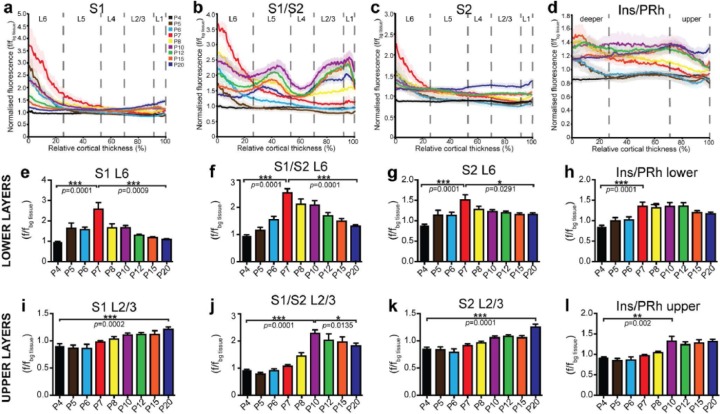
Figure 4.
Two periods of temporally, regionally, and layer-specific developmental exuberance in L2/3 S1 callosal neuron projections. Densitometric fluorescence analyses of labelled axons were assessed over nine developmental stages to obtain average traces for each age across the cortical plate in (a) S1, (b) S1/S2, (c) S2 and (d) Ins/PRh across different stages of development. (e)–(h) The average fluorescence intensity of each layer reveals a distinct peak of fluorescence at P7 (red) in L6 of all neocortical areas and possibly lower layers of Ins/PRh. The future sparsely innervated regions (S1 and S2) generally have a linear increase in fluorescence intensity in (i) and (k) upper cortical layers, whereas the densely innervated regions trend towards a peak of fluorescence at P10, followed by (j) and (l) slight retraction. f/fbg tissue: axonal fluorescence/fluorescence of background tissue. Data are represented as mean ± SEM. n ⩾ 7 animals per age.

