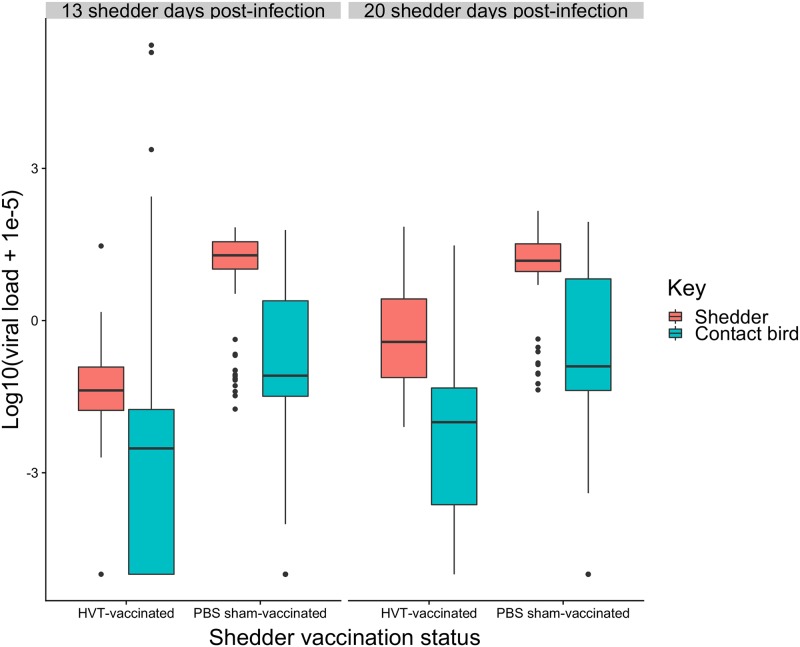
Fig 4. Box and whisker plot of shedder and contact FVLs at 13 and 20 DPI.
Horizontal bars are medians. Boxes cover the first to third quartile, and vertical lines extend to maxima and minima except in the presence of outliers (filled circles). Shedder feather samples were taken at the start of each contact period, contact samples at 14 DPC. A small value (1 × 10⁻⁵) was added to FVL values prior to log transformation, and hence the log10(viral load) for birds negative for virus was −5. Underlying data are in Edinburgh DataShare repository (https://doi.org/10.7488/ds/2725). DPC, days post-contact; DPI, days post-infection; FVL, feather viral load.

